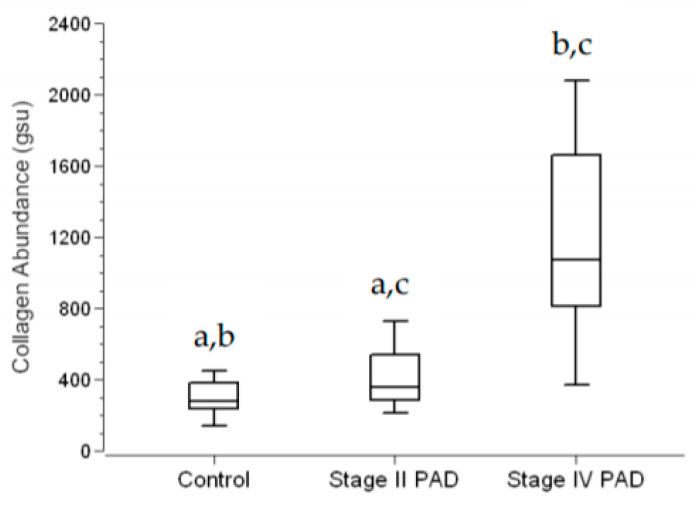
Figure 4.
Inter-myofiber Collagen Abundance in Calf Muscle of Control Subjects and Patients with Peripheral Artery Disease (PAD). Calf muscle biopsies were taken from control subjects (N = 14) and patients with Stage II (N = 15) and Stage IV PAD (N = 15), embedded in paraffin, sectioned at four microns, and stained with Masson Trichrome (MT). Microscopic images were captured with a Multi-Spectral imaging system. Quantitative greyscale images of inter-myofiber collagen were extracted from the Multi-Spectral images and quantified in the Image Pro® Premier environment. Collagen abundance (gsu) was computed as the sum of the products (gsu∙micron2) of mean pixel intensity and event area divided by the total area (micron2) of myofibers plus total area of inter-myofiber collagen, per microscopic field. The average of five fields per slide specimen was taken as the collagen abundance per patient. Data are presented as Fence Box Plots. Statistical significance was determined with the non-parametric randomization test. a—Significantly different at p = 0.041. b—Significantly different at p < 0.001 c—Significantly different at p < 0.001

