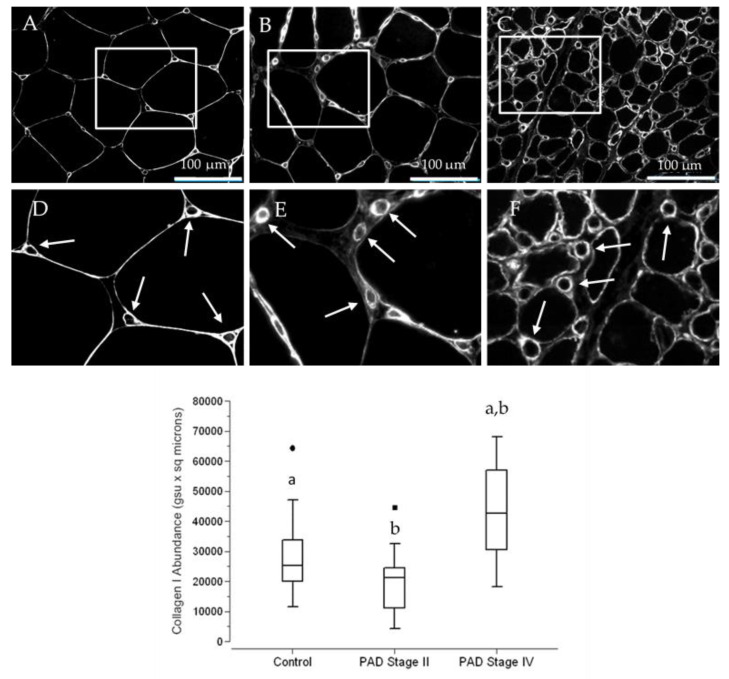
Figure 7.
Collagen I deposition presents as intensely labeled rings that delineate micro-vessels in the calf muscle of control subjects and PAD patients. Slide specimens of biopsies from calf muscle of control subjects (A) (N = 14) and patients with Stage II (B) (N = 15) and Stage IV (C) (N = 16) PAD were labeled with anti-Collagen I antibody, and fluorescence images were captured with a widefield microscope (40× objective). Selected regions in Panels (A–C) were enlarged (Panels (D–F)), providing a more detailed view of micro-vessel labeling (Arrows). The inner and overall diameter of the micro-vessel rings appears to be larger and more intense in the specimen from the patient with Stage IV disease, compared to specimens from the control subject and the patient with Stage II disease. Scale bars = 100 µm. Median Collagen I abundances per micro-vessel were determined by Quantitative Fluorescence Microscopy, computed as the product of ring area and mean labeling intensity, and are presented as Fence Box Plots. Collagen I was significantly increased in patients with Stage IV PAD compared to control subjects and Stage II patients. Data were analyzed by the randomization test where: a—significantly different at p < 0.002. b—significantly different at p < 0.001

