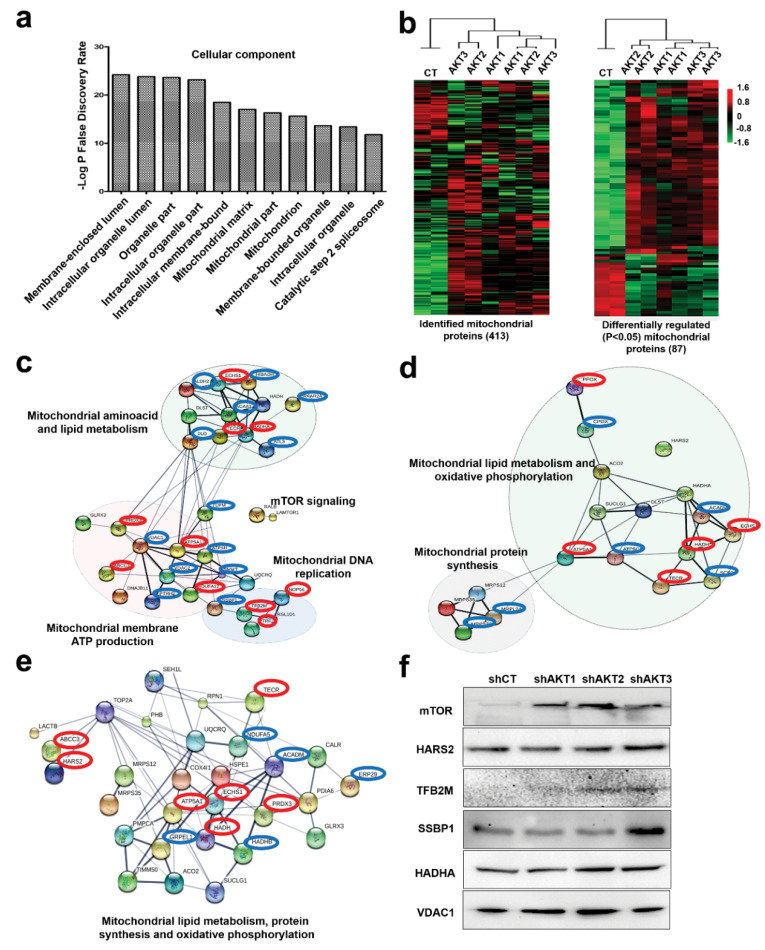
Figure 2.
The mitochondrial proteome is significantly altered in cells adapted to AKT silencing. (a) Bar graph with the top ten main cellular components in adapted cells to AKT silencing identified using STRING. (b) Left, cluster analysis of the identified mitochondrial proteome using two biological replicates per cell line (shown on top), represented by a heatmap. Right, the same as left but with significantly (P < 0.05) regulated mitochondrial proteins between the cell lines (P < 0.05) identified by ANOVA. (c) Functional interactomes with significantly upregulated proteins (P < 0.05) in cells adapted to AKT1 silencing compared to control cells, and to AKT2 silencing (d) and AKT3 silencing (e). In red, common upregulated proteins present in the three interactomes. In blue, upregulated proteins specific for the adaptation to the indicated AKT kinases. Thin and thick lines shown interactions with medium (0.7) or high (0.9) confidence by STRING. Regulated cellular processes by the functional interactome subgroups are highlighted and indicated. (f) Expression of the indicated proteins by Western blot in control cells and in cells adapted to silencing of the indicated AKT isoforms. Original uncropped Western blots and densitometry readings are shown in Figures S3–S8.

