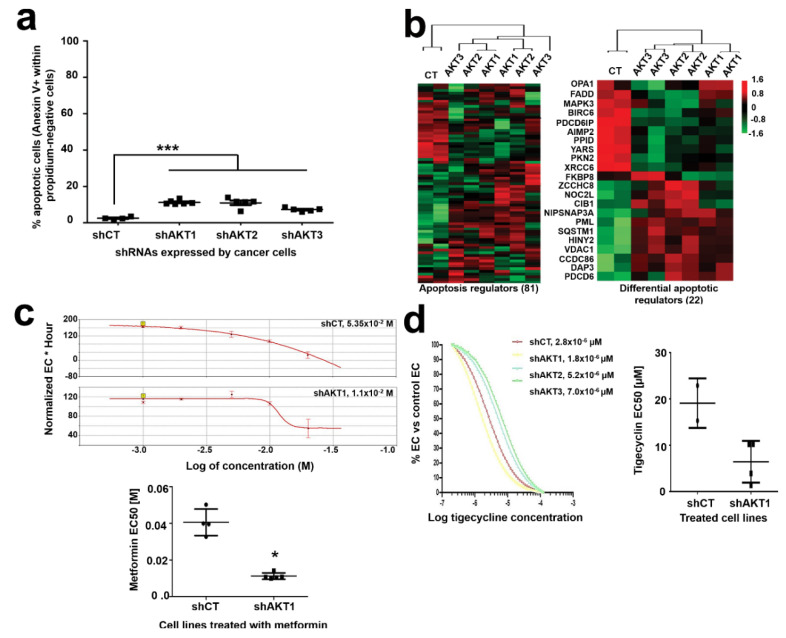
Figure 4.
Pancreatic cancer cells with silenced AKT isoforms are sensitive to mitochondria-disrupting agents. (a) Dot plot representing the percentage of spontaneous apoptosis in the indicated cell lines. Relevant statistical comparisons are shown by ANOVA and pairwise Tukey’s test. Means and standard deviations are also shown. (b) Cluster analysis of proteins involved in regulation of apoptosis (left) and those significantly regulated (right) by silencing of the indicated AKT isoforms. ***, indicate highly significant (p < 0.001) differences. (c) Top, RTCA EC50 (effective concentrations) curves of metformin treatments for the indicated cell lines, four replicates per concentration. The calculated EC50s for each graph are shown within the graph. Bottom, dot plot graph of EC50 values for metformin treatment calculated from five independent experiments as shown on top, in the indicated cell lines. The statistical comparison was performed with Student’s t test. (d) Left, RTCA EC50 curves of tigecycline treatments for cell lines with the indicated AKT isoforms silenced, calculated by RTCA. The EC50 values are shown. Right, dot plot graph of EC50 values for tigecycline calculated from four experiments. *, ***, indicate significant (p < 0.05) and highly significant (p < 0.001) differences.

