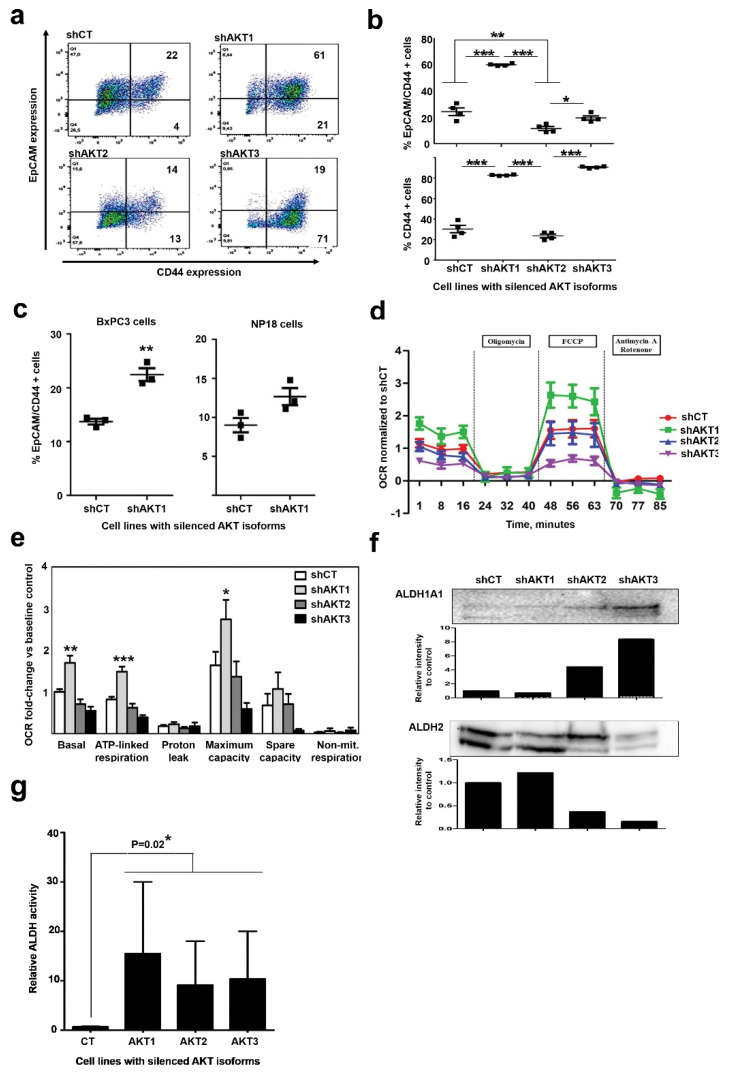
Figure 5.
Adapted cells to AKT1 silencing acquire characteristics of cancer stem-like cell. (a) Left Flow cytometry density plots of CD44/EpCAM co-expression in the surface of pancreatic cancer cell lines adapted to silencing of the indicated AKT isoform. Percentages of events are shown within each quadrant. (b) Scatter plots representing the percentage of cells that co-express CD44/EpCAM (top) or only CD44 (bottom). Data from four biological replicates are shown. Relevant statistical comparisons are shown within the graph, calculated by ANOVA and Tukey’s pairwise tests. (c) Scatter plots representing the percentage of cells that co-express CD44/EpCAM for the indicating cell lines. Data from four biological replicates are shown. Relevant statistical comparisons are shown within the graph, calculated by ANOVA and Tukey’s pairwise tests. (d) Graph displaying oxygen consumption rates (OCRs) in the indicated cell lines following the addition of oligomycin, FCCP or Antimycin-A/rotenone as shown. Results are shown as means from three technical replicates, together with error bars (SD). (e) Bar graph displaying oxygen consumption rate (OCR) for each indicated cell line quantified by Seahorse XF and normalized to baseline OCR from control cells following the addition of the indicated compounds. Data are shown as means and error bars OCR attributed to each mitochondrial function calculated from (C top), and data shown as means and error bars. (f) ALDH1A1 and ALDH2 expression by Western blot in the indicated cell lines. Densitometry data on the intensities of both proteins detected by Western blot compared to the controls shCT cell line is shown in the bar graphs below each Western blot. Original uncropped Western blots and densitometry readings are shown in Figures S9 and S10. ALDH2 presents two bands with different electrophoretic mobility due to acetylation. Densitometry was carried out integrating the intensities from both bands. (g) Bar graph representing relative ALDH activity quantified by the Aldefluor flow cytometry staining method, with means and standard deviations as error bars. Relevant statistical comparisons are shown by two-way ANOVA, and Tuckey’s pairwise tests. *, **, ***, indicate significant (p < 0.05), very significant (p < 0.01) and highly significant (p < 0.001) differences.

