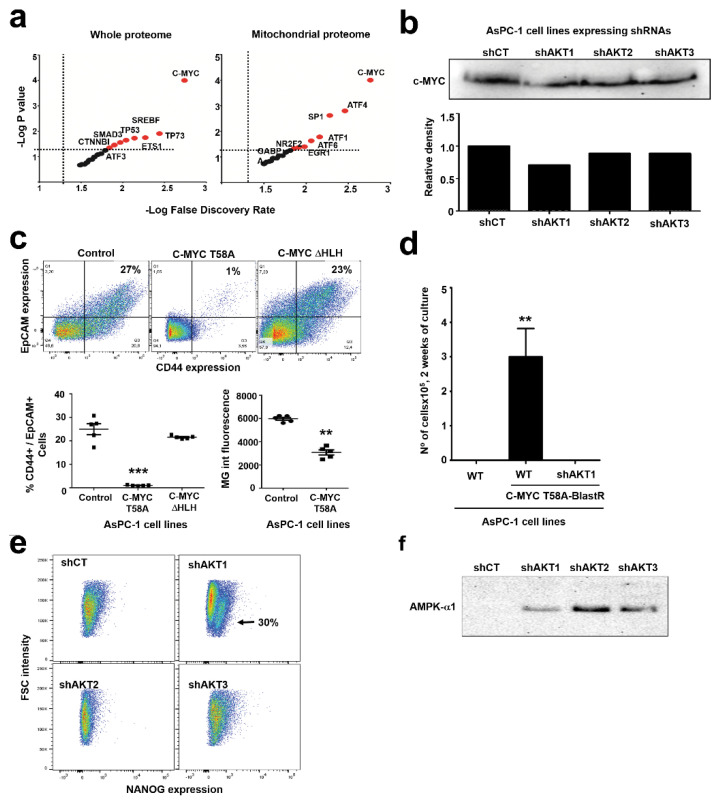
Figure 7.
Adaptation to AKT1 silencing uncovers specific regulation of C-MYC, NANOG and AMPK. (a) Dot plots of transcription factors (indicated within the graph) associated to potential regulation of the proteomes associated to silencing of AKT isoforms compared to shCT-control cancer cells. The left graph represents data from the whole differential proteomes, while the right graph represents data from the mitochondrial differential proteomes. Horizontal and vertical dotted lines separate statistically significant P values and false discovery rates for each identified transcription factor. In red, transcription factors with significant association to the differential proteomes. (b) The Western blot on top shows C-MYC expression in the indicated AsPC-1 cell lines. The bar graph indicates the band intensity from the Western blot above. (c) The flow cytometry density plots show CD44/EpCAM expression in the indicated cell lines. Percentages within the graphs show the percentage of CD44-EpCAM double positive AsPC-1 cells. The scatter plot represents the same data from five independent experiments. Statistical comparisons were performed by ANOVA and pairwise Tukey’s tests. (d) Bar graph representing means and standard deviations of the number of the indicated cell lines transduced with the lentivector expressing active C-MYC and blasticidin resistance, after two weeks of selection. Statistical comparisons were performed by one-way ANOVA. (e) NANOG expression assessed by flow cytometry in the indicated cells lines. A well-defined NANO-positive population is indicated with an arrow. (f) AMPK expression by Western blot in the indicated cell lines. *, **, ***, indicate significant (p < 0.05), very significant (p < 0.01) and highly significant (p < 0.001) differences, respectively. Original uncropped Western blots and densitometry readings are shown in Figure S11.

