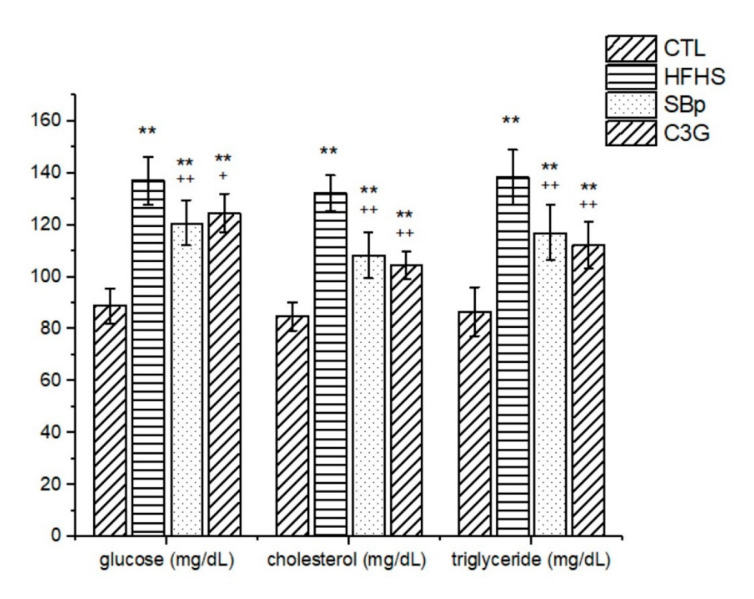
Figure 2.
Levels of glucose, cholesterol and triglycerides in plasma of mice fed with HFHS diets supplemented with or without C3G. The dietary regimen was the same as described in the legend of Figure 1. Fasting plasma glucose, cholesterol and triglycerides were measured biochemically using assay kits. Values are expressed as mean ± SD mg/dL (n = 8/group). **: p < 0.01 versus the control (CTL) group; +, ++: p < 0.05 or 0.01 versus the HFHS group.

