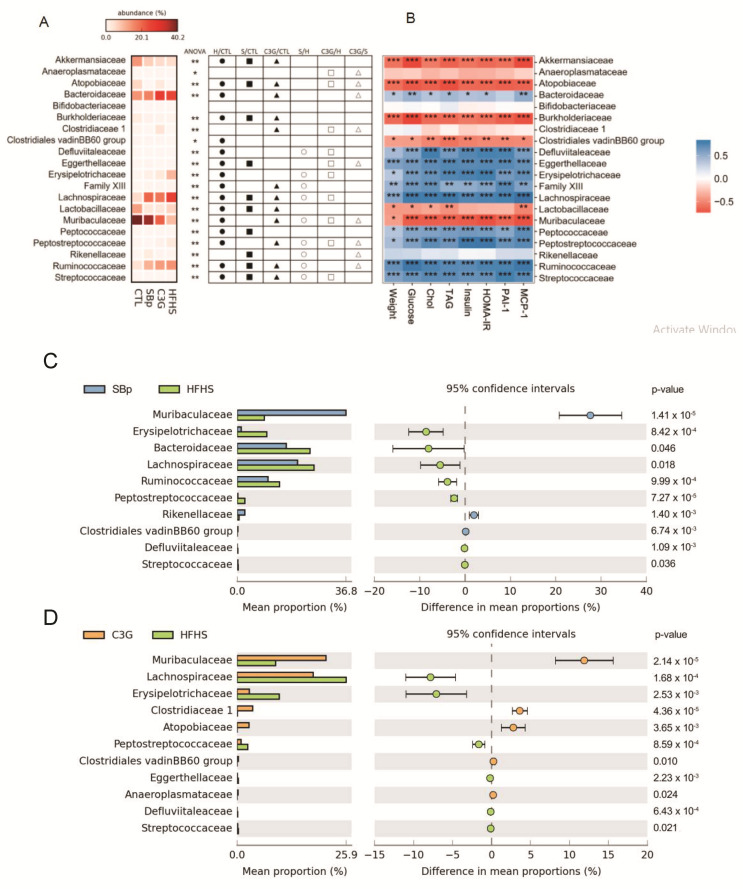
Figure 7.
Effect of four HFHS (H) diets supplemented with C3G on the relative abundance of gut family bacteria. The experimental regimen was described in the legend of Figure 1. (A) Statistical differences among mice with different diets (analysis of variance (ANOVA) and post-hoc Tukey test), (B) correlation heatmap of relative abundance of gut microbiota on family level with physiological and biochemical parameters, (C) extended error bar plot (STAMP tool) showing difference in mean relative abundance between the SBp (S) group and HFHS group, (D) mean proportion and difference in mean proportion of family bacteria (STAMP tool) between the C3G group and the HFHS group (mean ± SD). ∗: p < 0.05 in overall ANOVA result, ●: p < 0.05 in the HFHS (H) group versus the control (CTL) group (H/CTL), ■: p < 0.05 in the SBp (S) group versus the CTL group (S/CTL), ▲: p < 0.05 in the C3G group versus the CTL group (C3G/CTL), ○: p < 0.05 in the S group versus the H group (S/H), □: p < 0.05 in the C3G group versus the H group (C3G/H), △: p < 0.05 in the C3G group versus the S group (C3G/S). *, **, ***: p < 0.05 or 0.01 or 0.001 in positive (blue) or negative (red) correlations between the abundance of each gut family bacteria and physiological or biochemical variables.

