
Figure 4. CD31low cells are resistant against doxorubicin-induced apoptosis.
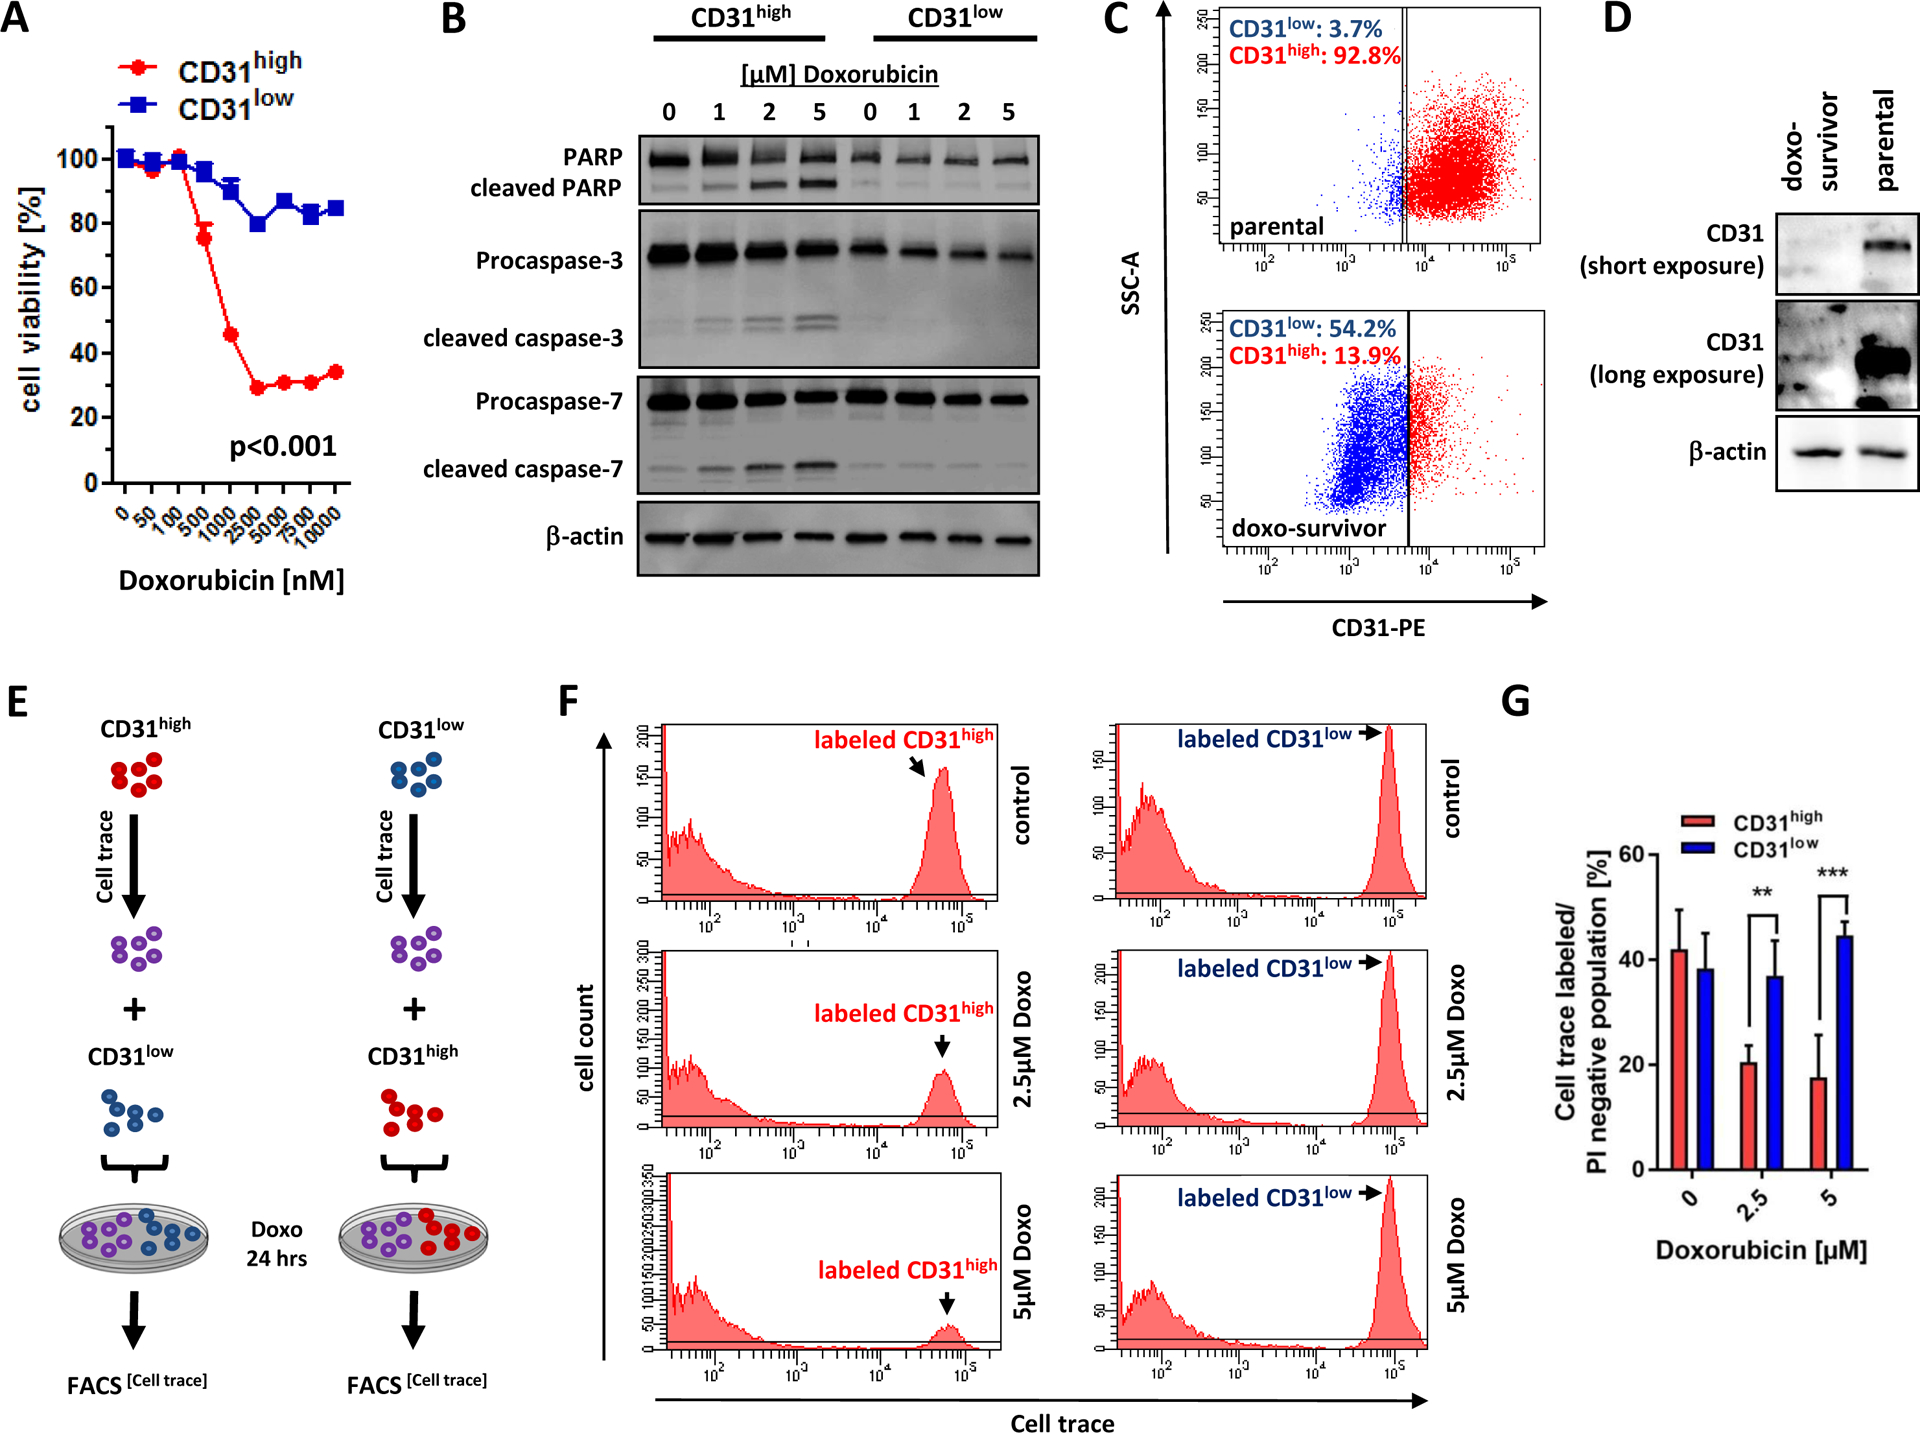
(A) Both sublines were treated with increasing concentrations of doxorubicin for 24 hours and cell survival was determined using MTS assay. At concentrations >500nM, CD31low cells survived significantly better than CD31high cells (p<0.001). (B) Immunoblot analysis of CD31low and CD31high cells treated with increasing concentrations of doxorubicin showed activation of apoptotic enzymes (cleaved PARP, cleaved caspase-3 and −7) only in CD31high but not in CD31low cells. See also Supplementary Figure 2A for densitometric quantification. (C) Parental CD31 heterogeneous ASM cells with a high CD31 subpopulation (CD31high:92.8% vs CD31low: 3.7%) were treated with 1 μM doxorubicin (respective isotype controls are presented in Supplementary Figure 2B). After 24 hours treatment, medium was changed to normal. After seven days the surviving ASM cells (termed doxo-survivors) were analyzed for CD31 expression via flow cytometry and (D) Western Blot. See also Supplementary Figure 2B and C for morphology and functional features of parental and doxo-surviving ASM cells. (E) Schematic description of cell trace experiments. CD31high (or CD31low cells, respectively) were labeled with the tracer dye CellTrace Violet and then mixed with equal numbers of CD31low cells (or CD31high cells, respectively) and then incubated with increasing doses of doxorubicin for 24 hours. (F and G) FACS analysis of these mixed labeled cell populations revealed preferential depletion of CD31high cells, while the size of the labeled CD31low population remained stable. All data are mean ± SEM and were analyzed using two-way ANOVA followed by Bonferroni’s multiple comparisons test (*p < 0.05;**p < 0.01; ***p < 0.001).