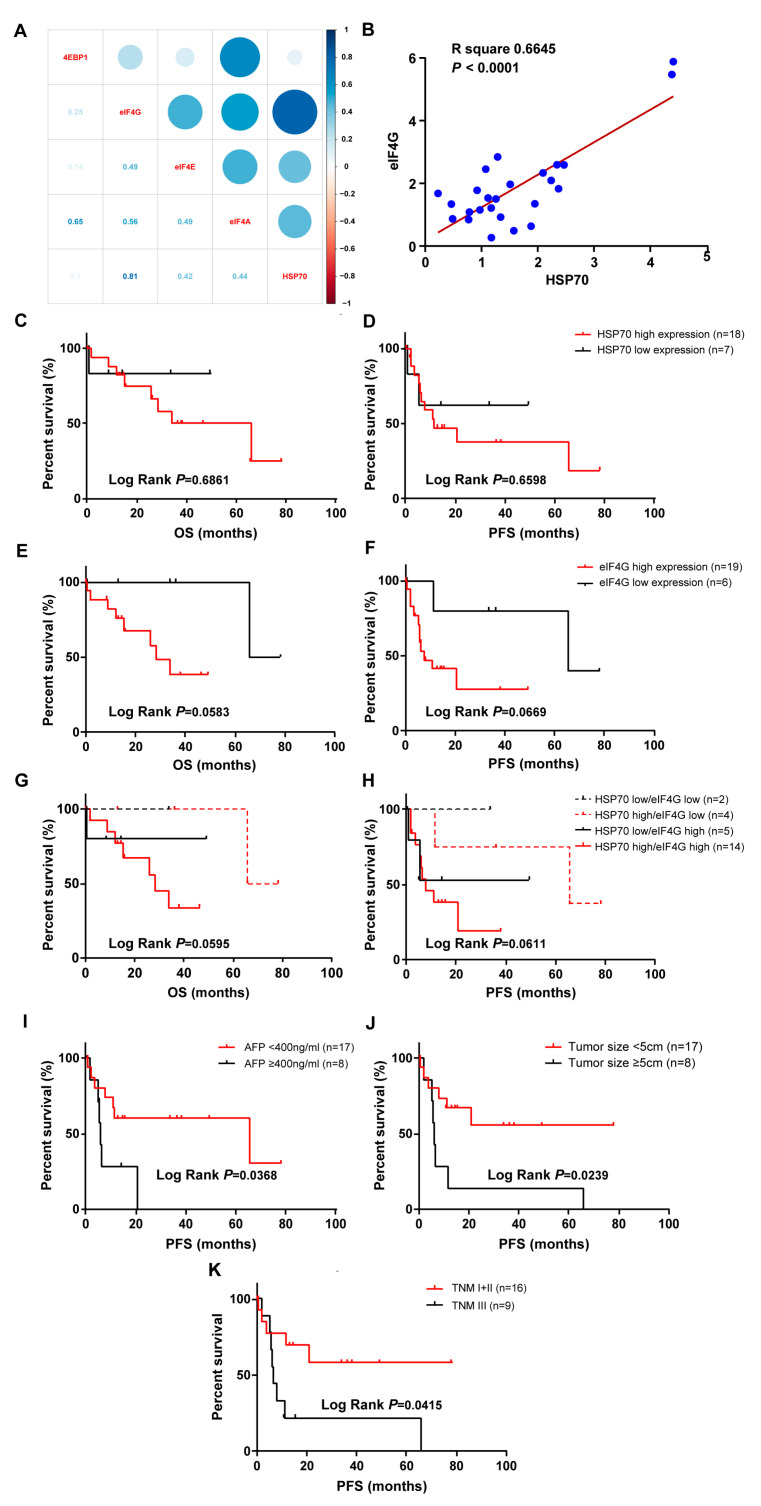
Figure 2.
The expression of HSP70 and eIF4G positively correlated in tumor specimens of patients with HCC. High and low expression of HSP70 or eIF4G are defined in Materials and Methods. (A) Correlation plot showing the relationships between HSP70 and eIF4A, eIF4E, eIF4G, and 4EBP1, respectively. Light blue indicates the highest correlation while light red indicates the lowest correlation. (B) The relative protein expression of HSP70 and eIF4G in HCC tissues was positively correlated. (C,D) The OS and PFS in HCC patients with high and low HSP70 expression were evaluated. (E,F) The OS and PFS of HCC patients were assessed based on high and low eIF4G expression. (G,H) HCC patients were divided into four groups of low HSP70 expression/low eIF4G expression, high HSP70 expression/low eIF4G expression, low HSP70 expression/high eIF4G expression, and high HSP70 expression/high eIF4G expression. The OS and PFS of each group were analyzed. (I–K) The PFS of HCC patients was compared according to clinical features of AFP level (I), tumor size (J), and TNM stage (K). The survival curves were plotted by the Kaplan-Meier method, and p values were calculated by the log-rank test.

