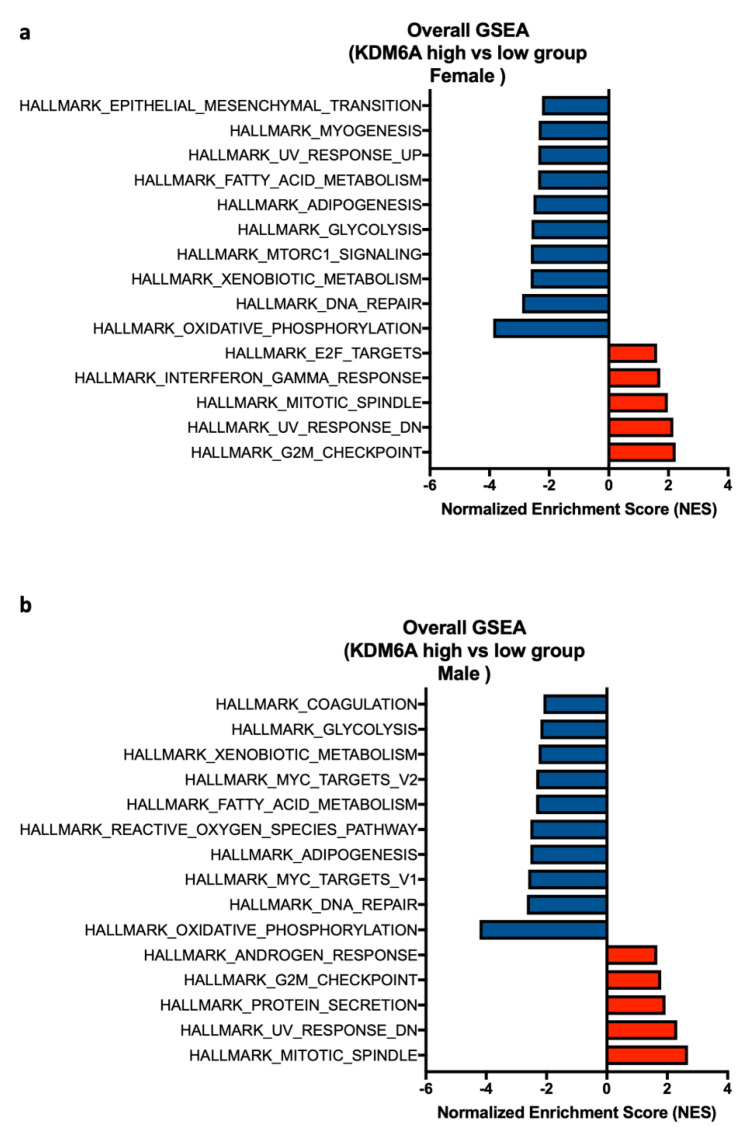
Figure 5.
Gene set enrichment analysis of KDM6A high vs. low group based on sex. A forest plot represents the top 5 pathways that are positively enriched and 10 negatively enriched pathways using the NES score in (a) female and (b) male KDM6A high vs. low group. Pathways with normalized p-value < 0.05 refer to the significance and are shown in the plot.

