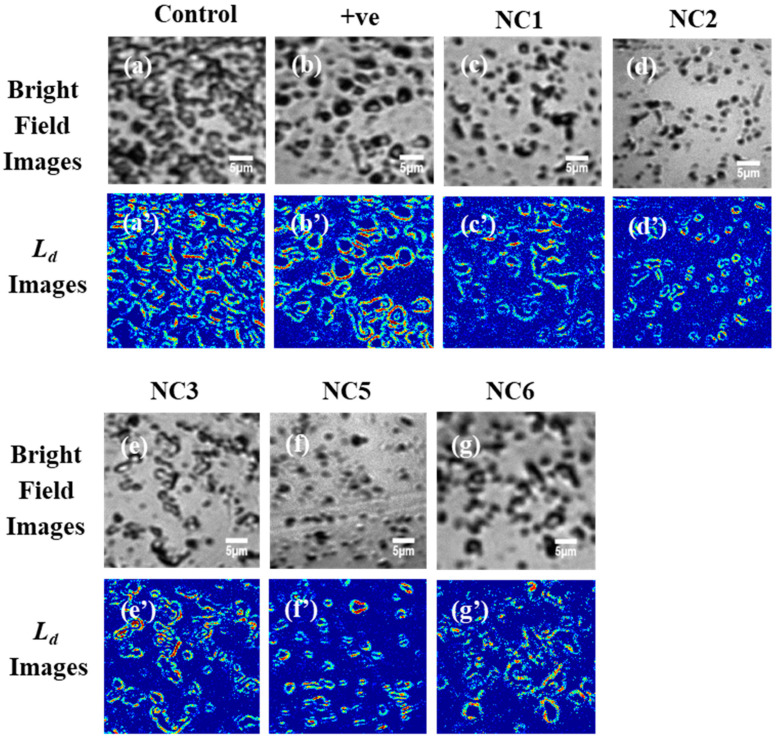
Figure 3.
(a–g) are the representative bright field images of control, positive control (with AgNO3 + NaBH4) and different (NC1, NC2, NC3, NC5, NC6) aptamer enclosed nanocluster treated samples of Pseudonomas aeruginosa while (a’–g’) are their respective Ld images. In the Ld images, red spots represent a higher degree of refractive index or mass density fluctuations which are easily distinguishable. Long connecting bacterial structures are the sign of biofilm formation.

