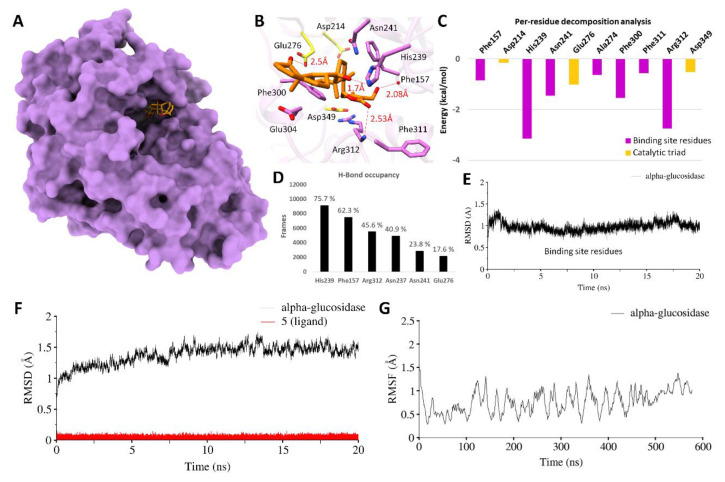
Figure 4.
Molecular surface representation of α-glucosidase. (A) MD simulated binding pose of 5 (orange sticks) inside the binding pocket. Residues are highlighted in stick representation and catalytic triad residues are colored yellow. (B) H-Bonds with distance are displayed beside each bond. (C) Per-residue decomposition analysis of binding pocket residues, while catalytic triad residues are colored yellow. (D) H-Bond occupancy and (E) root-mean-square-deviation (RMSD) of binding pocket residues over a period of 20 ns. (F) RMSD of backbone atoms of α-glucosidase (in black) along with ligand (in red) and root mean square fluctuations and (RMSF) (G) are displayed over a period of 20 ns.

