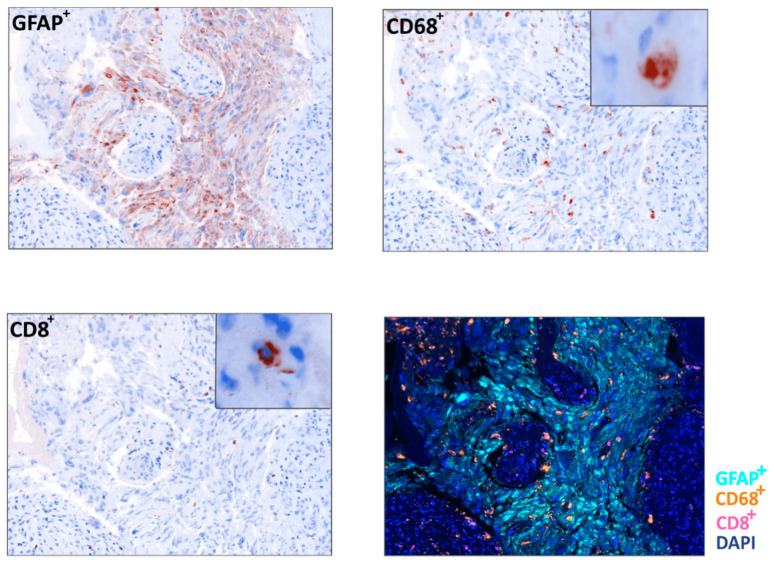
Figure 4.
Immune infiltrate analysis in a glioblastoma sample. Representative example of a Multispectral Imaging field obtained from a glioblastoma sample in which the markers GFAP (light blue), CD68 (orange) and CD8 (pink) are reported (20× zoom, lower right panel) and relative pseudo-immunohistochemistry representations of the single cell populations (40× zoom). DAPI (blue) was used as nuclear counterstain.

