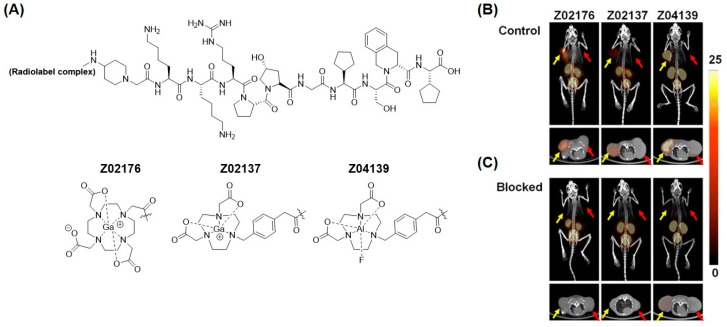
Figure 8.
Optimization of B1R radiopharmaceuticals. (A) Chemical structure of B1R radioligands. (B) Representative 1 h post-injection MIP (maximum intensity projection) and axial PET/CT images of radiolabeled Z02176, Z02137, and Z04139 in mice bearing both B1R+ (indicated by yellow arrows) and B1R– (indicated by red arrows) tumors without and (C) with co-injection of 100 μg cold standard. The displacement in tumor uptake demonstrates target specificity of the imaging agent. The scale bar is in units of %ID/g. Figure reproduced from Zhang, Z.; et al. [82].

