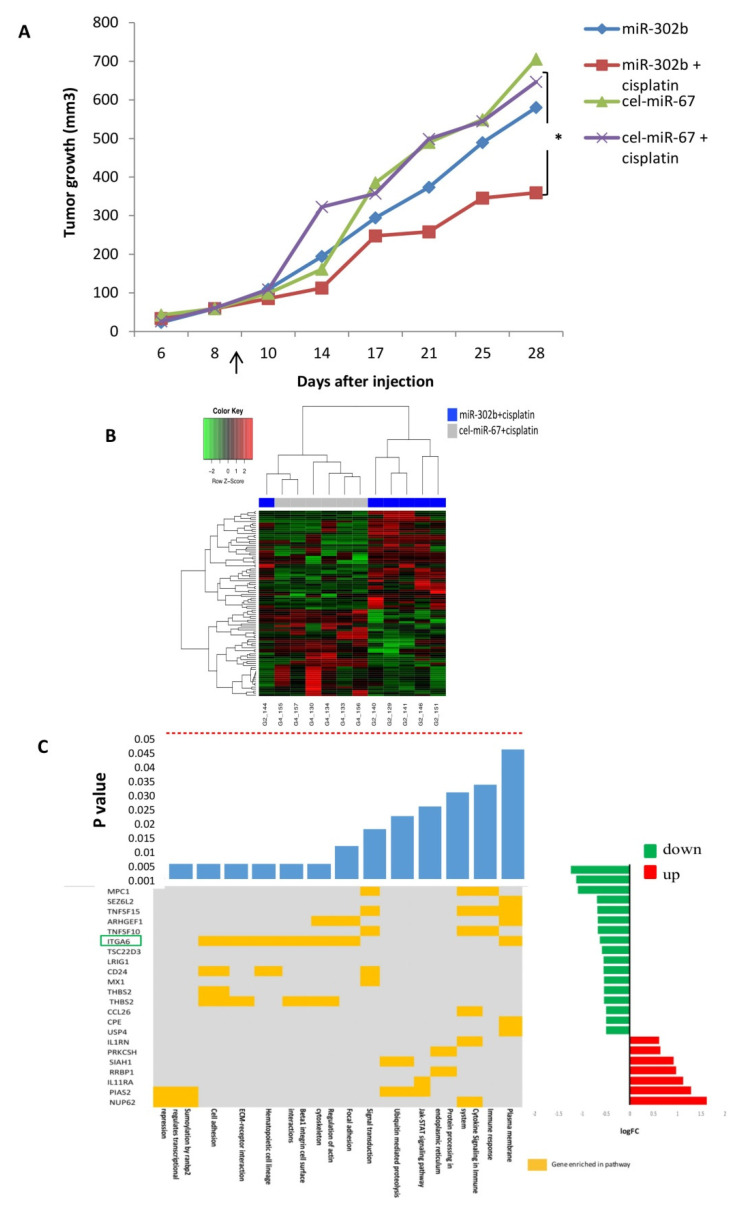
Figure 1.
Effects of miR-302b and cisplatin treatment in an orthotopic murine triple-negative breast cancer (TNBC) model and transcriptional landscape established by miR-302b and cisplatin treatment in an in vivo assay. (A) Tumor volumes in Severe Combined Immunodeficient (SCID) mice after the peritumoral injection of miR-302b or miR-cel-67 control plus cisplatin or saline treatment evaluated across different time points. Data presented are mean values (n = 7; * p ≤ 0.05 Student’s t-test). Arrow indicates start of treatment. (B) Heatmap showing the differentially expressed genes (log fold change > 0.5 and p ≤ 0.05) in mice tumors treated with miR-302b mimic plus cisplatin versus cel-miR-67 plus cisplatin. Red or green colors represent up- or down-modulation, respectively; normalized gene expression was adjusted to y–z score. (C) Common plot showing gene enrichment analysis based on differently expressed genes. The top bar plot shows the significance of each enriched pathway. Middle panel shows the belonging of a particular gene to any of the enriched pathway (yellow mark). The right bar plot shows the log fold change values of each gene computed by the comparison of mice treated with miR-302b+cisplatin versus mice treated with cel-miR-67 negative control+cisplatin. Red or green colors represent up or down-modulation, respectively. Highlighted gene in green represent the selected candidate for further analysis.

