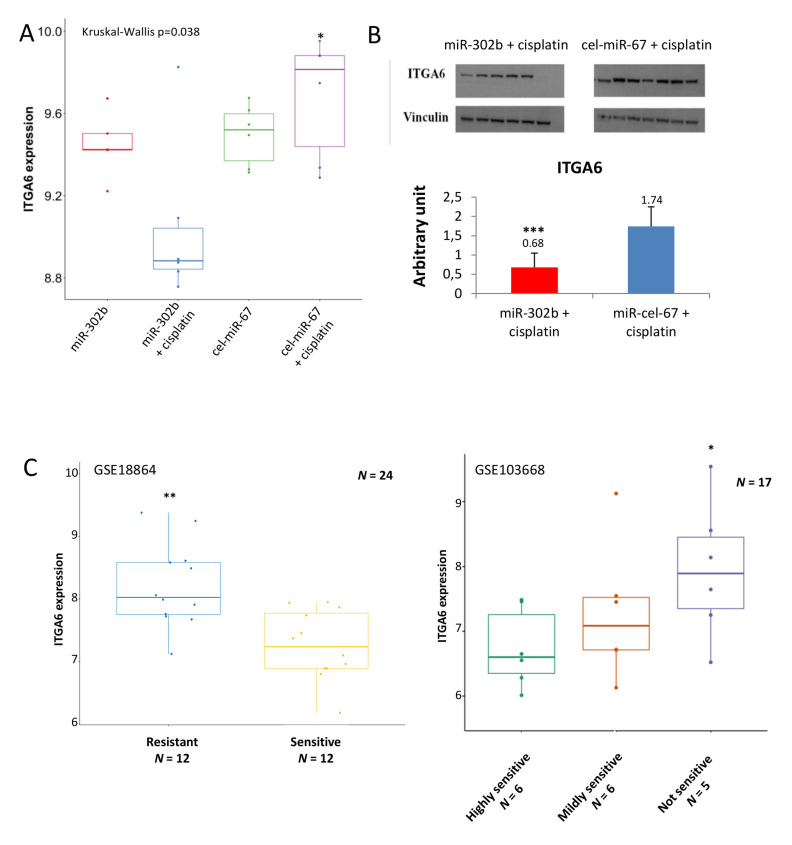
Figure 2.
Integrin Subunit Alpha 6 (ITGA6) expression in tumor from mice treated with miR-302b mimic and cisplatin and in public data sets. (A) ITGA6 mRNA expression extrapolated from gene expression analysis in each biological group of the in vivo assay (miR-302b mimic; miR-302b mimic+cisplatin; cel-miR-67 negative control; cel-miR-67 negative control+cisplatin) (* p ≤ 0.05 miR-302b+cisplatin versus cel-miR-67 negative control+cisplatin). (B) Western blot analysis of ITGA6 protein expression in mice tumors treated with miR-302b mimic plus cisplatin and cel-miR-67 plus cisplatin. Upper figure shows specific ITGA6 bands and vinculin bands as housekeeping; lower histogram represents ITGA6 densitometric quantification (*** p ≤ 0.001). (C) Right panel shows ITGA6 expression in 24 TNBC patients treated in neoadjuvant with cisplatin (GSE18864). Left panel shows ITGA6 expression in additional 17 TNBC patients treated in neoadjuvant with cisplatin (GSE103668). (* p ≤ 0.05; ** p ≤ 0.001).

