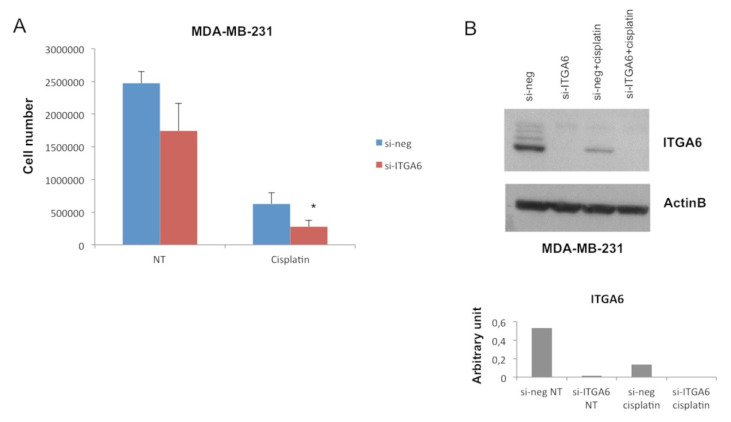
Figure 3.
Combinatorial effect of small interfering-ITGA6 (si-ITGA6) and cisplatin in an in vitro TNBC model. (A) MDA-MB-231 cell count following si-ITGA transfection and cisplatin treatment compared with their negative controls. (B) Western blot analysis of ITGA6 protein expression in MDA-MB-231 cells transfected with si-ITGA6 and treated with cisplatin compared with their negative controls. Upper figure shows specific ITGA6 bands and β-actin bands as housekeeping; lower figure shows histograms representing ITGA6 densitometric quantification. Data are representative of three independent experiments performed at least in triplicate (* p ≤ 0.05, Student’s t-test).

