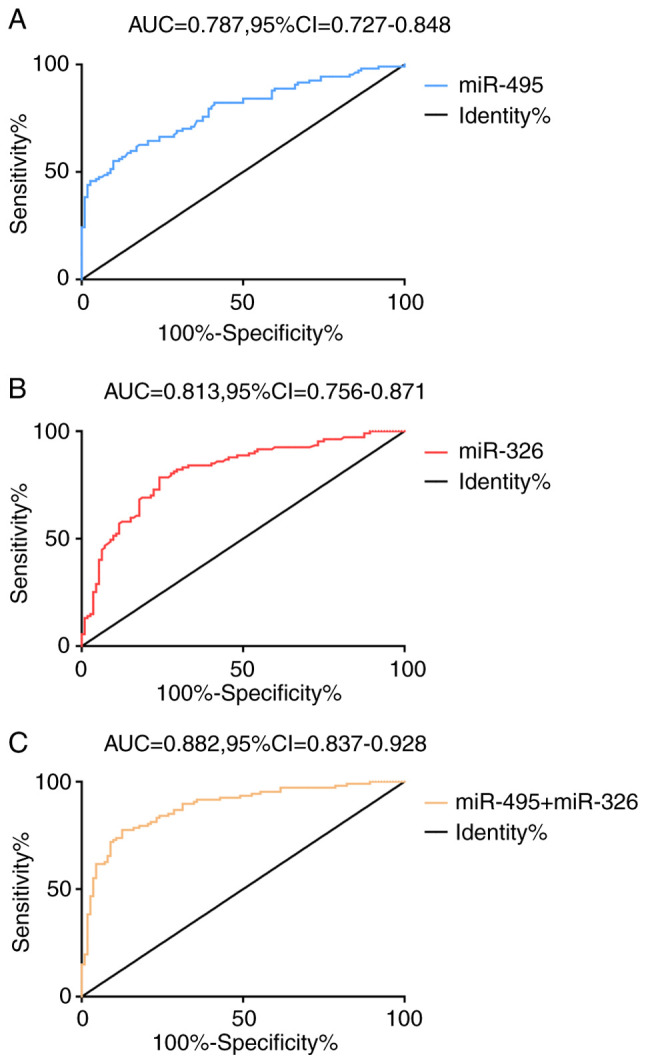
Figure 2.

Diagnostic value of miR-495 and miR-326 for RA. ROC curve analysis of (A) miR-495, (B) miR-326 and (C) miR-495 combined with miR-326 for the diagnosis of RA. miR, microRNA; RA, rheumatoid arthritis; AUC, area under the curve; CI, confidence interval.
