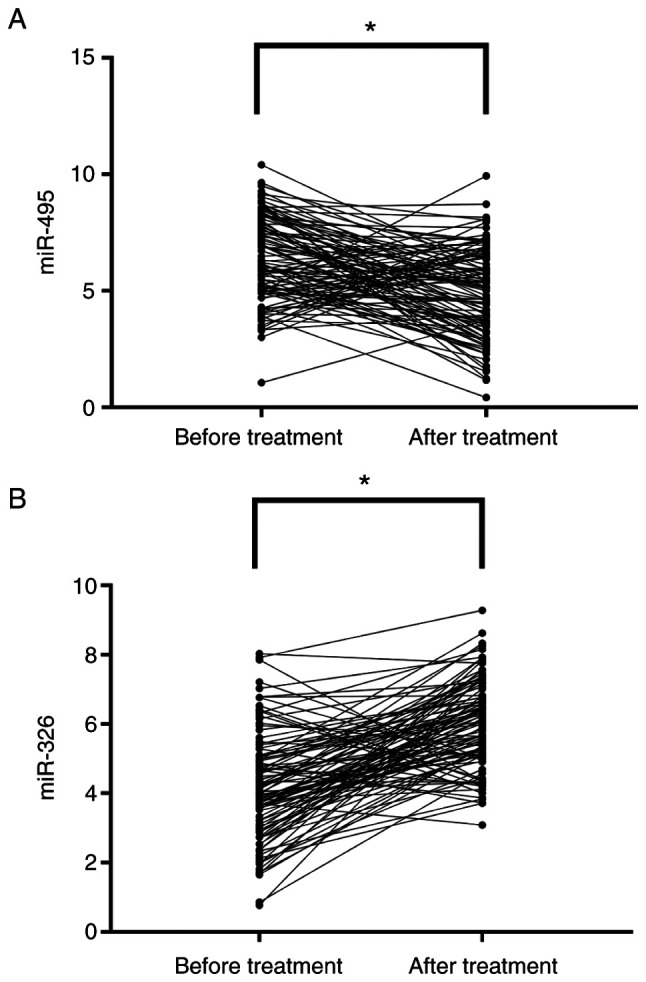
Figure 3.

Comparison of miR-495 and miR-326 expression in the study group before and after treatment. (A) After treatment, the miR-495 expression in the study group was significantly lower than that before treatment, *P<0.001. (B) After treatment, the miR-326 expression in the study group was significantly higher than that before treatment, *P<0.001. miR, microRNA.
