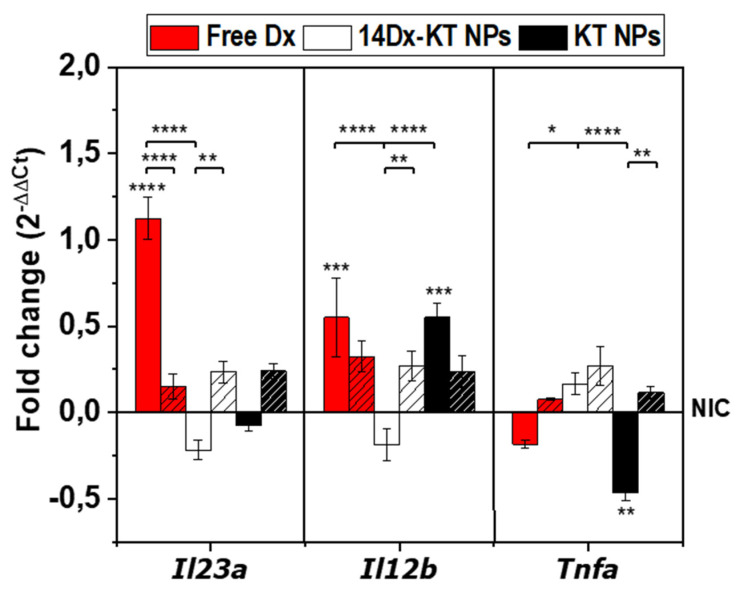
Figure 6.
Quantitative real-time PCR data. Graphical presentation of gene transcript levels of M1 markers in non-LPS-activated samples (non-inflammatory condition, NIC) treated with free dexamethasone (free Dx, 5.1 μM, red), Dx-loaded ketoprofen-bearing NPs (14Dx-KT NPs, 5.1 μM Dx, and 0.045 mg/mL NPs, white) and unloaded ketoprofen-bearing NPs (KT NPs, 0.045 mg/mL, black) for 1 day (plain) and 7 days (dashed). Results are expressed relative to the corresponding level of expression of each transcript in the untreated sample. The diagrams include the mean, the standard deviation (n = 2), and the ANOVA results (*—comparison with untreated NIC control, * p < 0.05, ** p < 0.01, *** p < 0.001 and **** p < 0.0001).

