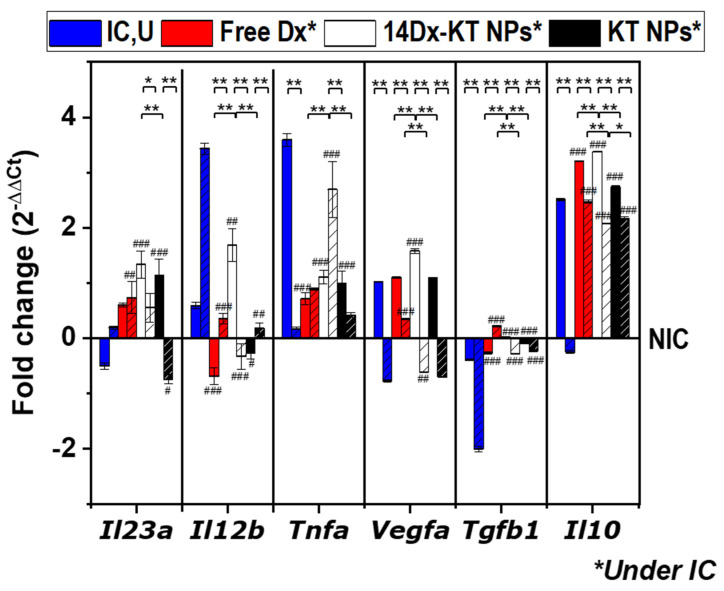
Figure 7.
Quantitative real-time PCR data. Graphical presentation of gene transcript levels of M1 markers (Il23a, Il12b, and Tnfa) and of M2 markers (Vegfa, Tgfb1, and Il10) in samples treated with LPS (500 ng/mL) and either treated with culture media (IC,U, blue), free dexamethasone (free Dx, 5.1 μM, red), Dx-loaded ketoprofen-bearing NPs (14Dx-KT NPs, 5.1 μM Dx and 0.045 mg/mL NPs, white), and unloaded ketoprofen-bearing NPs (KT NPs, 0.045 mg/mL, black) for 1 day (plain) or 7 days (dashed). Results were expressed relative to the corresponding level of expression of each transcript in non-inflammatory conditions (RAW264.7 alone, NIC). The diagrams include the mean, the standard deviation (n = 2), and the ANOVA results (#—comparison with IC,U control, # p < 0.05, ## p < 0.01, and ### p < 0.001; *—comparison between systems, * p < 0.05 and ** p < 0.01).

