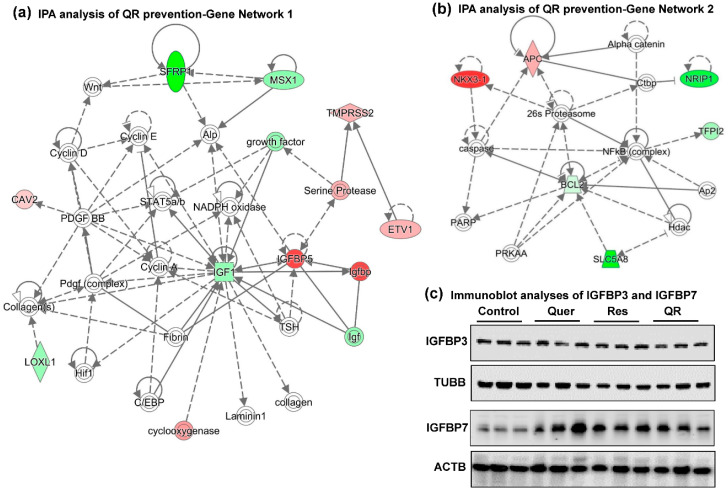
Figure 5.
Gene networks analysis of quercetin–resveratrol modulated genes suggest IGF1 and BCL2 as key signaling nodes associated with anti-PCa effects. Differentially expressed genes from PCa PCR array with cut-off criteria of ≥2-fold change in any one treatment group with statistically significant change (p < 0.05), and ≥ 1.5-fold change in any other group (total 22 genes) were uploaded in Ingenuity Pathway Analysis (IPA) software. (a) Gene network 1 indicating IGF1 inhibition as a key player interacting with most of the genes in the network. (b) Gene network 2 indicating BCL2 inhibition as another important player interacting with most of the genes in the network. Red indicates upregulated genes, green indicates downregulated genes, and uncolored nodes indicate genes not included in the PCR array but appeared during IPA analysis to connect the genes of the network. Solid lines indicate robust interactions, whereas dashed lines are significant but less frequent. (c) Immunoblot analyses of IGFBP3 and IGFBP7 proteins. TUBB and ACTB were used as a loading control.

