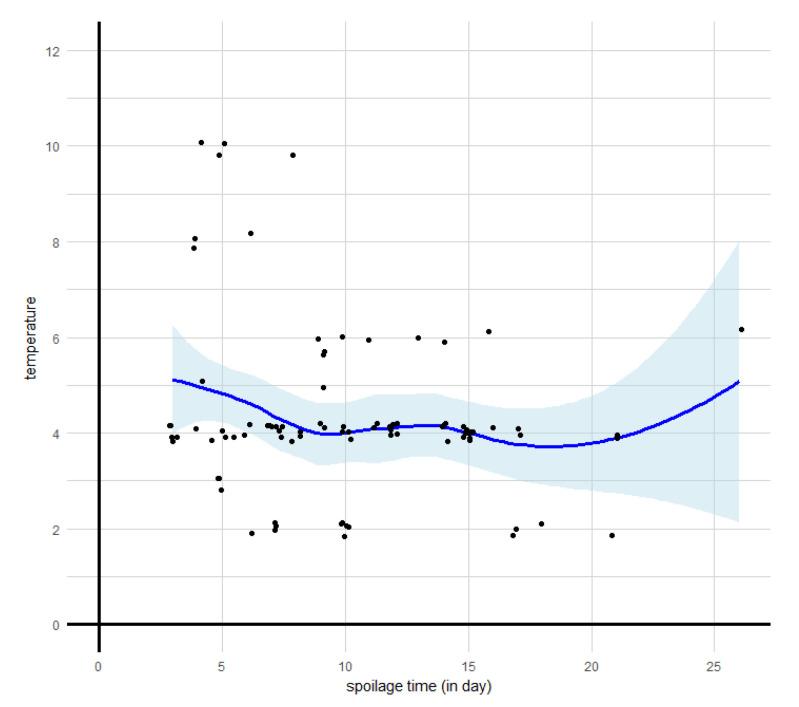
Figure 7.
Spoilage occurrence time observed at different storage temperatures. The data are represented as jitter points to avoid overplotting. The thick black line represents the smooth curve obtained by LOESS local non-linear regression. The grey band corresponds to the 95% confidence interval around the smooth curve. The vertical dotted line corresponds to the median spoilage time characterizing early and belated spoilage stages.

