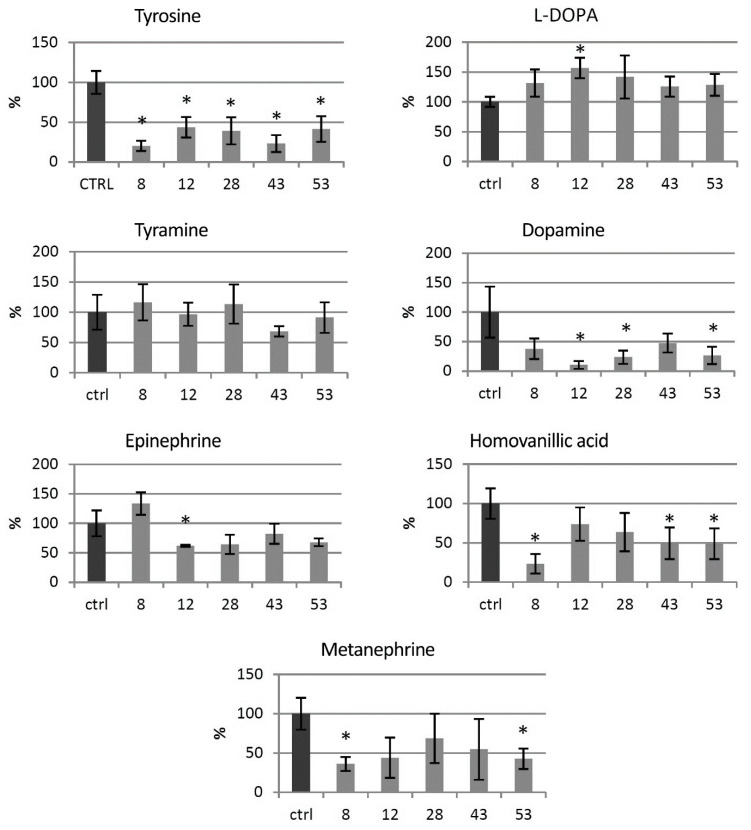
Figure 3.
Levels of catecholamine group metabolites in HTZ transgenic lines relative to the control (non-transgenic potato) obtained with the GC–MS technique, presented as the means of six biological replicates ± standard deviation. Statistically significant changes (p < 0.05) are marked with asterisks.

