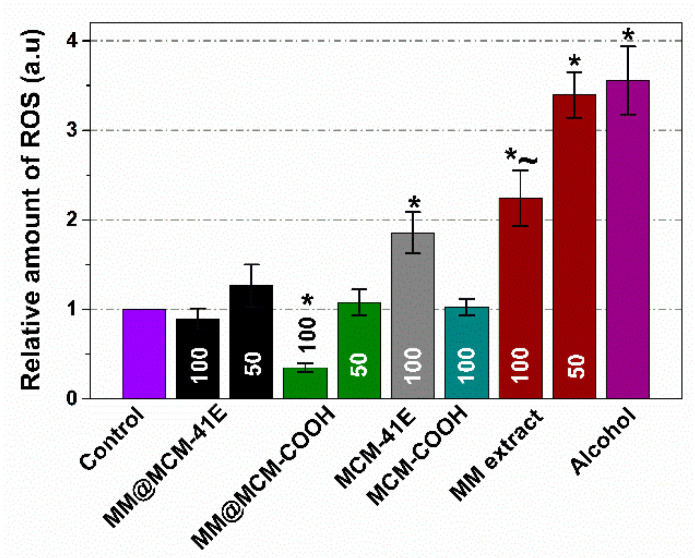
Figure 10.
Intracellular reactive oxygen species (ROS) levels at 24 h on NIH3T3 (50 and 100 mean the sample concentration in μg/mL). Data are presented as mean ± SD (n = 3). * p < 0.05 compared to Control (cells grown w/o any compound); ~ p < 0.05 compared to alcohol (cells grown with alcohol in concentration corresponding to the highest concentration of ethanol from the extracts) (Student t-test).

