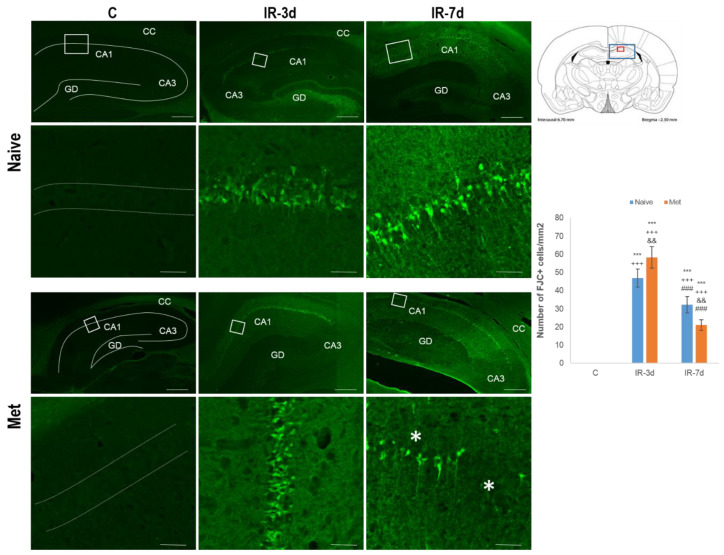
Figure 3.
FluoroJade-C stained rat brain sections and statistical evaluation of the changes in the number of disintegrated neurons in the CA1 region of the hippocampus. The first line shows fluorescent low magnification micrographs of the rat hippocampus representing naïve control (C), naïve IR-3d and naïve IR-7d groups. The third line represents low-magnification fluorescent micrographs of the rat hippocampus of Met-C, Met-IR-3d and Met-IR-7d. Details of the corresponding group focusing on the CA1 region of the hippocampus are shown in lines two and four. Arrows indicate FJC+ neurons while arrowhead points at morphologically changed neurons. White squares in the first and third columns present area of magnification. An asterisk is placed at the area of neuronal breakdown. CC—corpus calosum, CA3—cornu ammonis 3, GD—gyrus dentatus. Bar = 500 and 50 µm; n = 5/group. Schematic coronal rat brain section (the upper right corner), redrawn according to Paxinos and Watson [26] poses hippocampus (blue rectangle) and smaller (red rectangle) detects CA1 area of rat hippocampus. The number of disintegrated neuronal cells in the CA1 area of the hippocampus (the middle right corner) in the naïve control, Met-C, IR-3d, Met-IR-3d, IR-7d and Met-IR-7d. Results are presented as mean ± standard deviation (SD), n = 5/group. *** p < 0.001 versus the control value; +++ p < 0.001 versus the Met-C, && p < 0.01 versus the groups with the same reperfusion period with/without Met diet pre-treatment, ### p < 0.01 versus IR-3d with/without Met diet.

