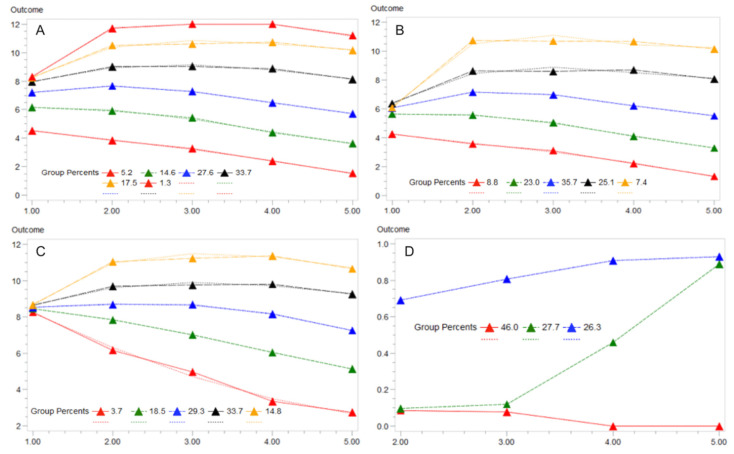
Figure 1.
Group-based trajectory models (GBTM) of Short Physical Performance Battery (SPPB, “Outcome” on y-axis) over 5 follow-up periods in the LIFE Study (x-axis) using a censored normal distribution model. Final models (i.e., number of groups) were selected based on the best overall model fit criteria (Bayesian Information Criterion). Group membership percentages are displayed along with lines of best fit (dashed lines). (A) includes the full LIFE Study sample with the best model being a 6-group trajectory. (B,C) stratified the sample by SPPB ≤ 7 or > 7 given the dependence of the overall model on the initial value of SPPB. (D) represents the final binary failure model of the standardized outcome of ”declined SPPB” based on a reduction from baseline of ≥1 point. Note: y-axis is total SPPB score in panels A/B/C. y-axis is the probability of a ≥1-point decline in SPPB in panel D. X-axis is follow-up time in each panel.

