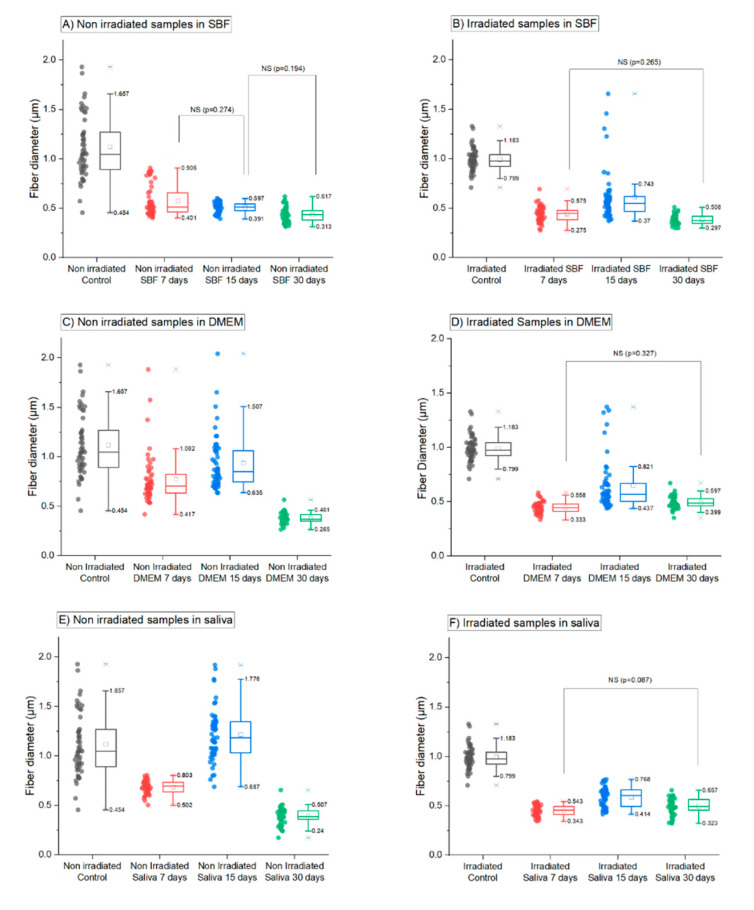
Figure 4.
Distribution of fibers diameter for non-irradiated (left) and gamma irradiated PLGA fibers (right) after in vitro degradation during 30 days of immersion in SBF (A,B), DMEM (C,D) and saliva (E,F) (the mean value of the diameters is represented by a square and median value by a horizontal line in the box). NS indicates that the difference of the means is not significant at the 0.05 level (probability specified in bracket and calculated via a Tukey test). If nothing is specified, the difference of the means is significant at the 0.05 level for a pair of samples.

