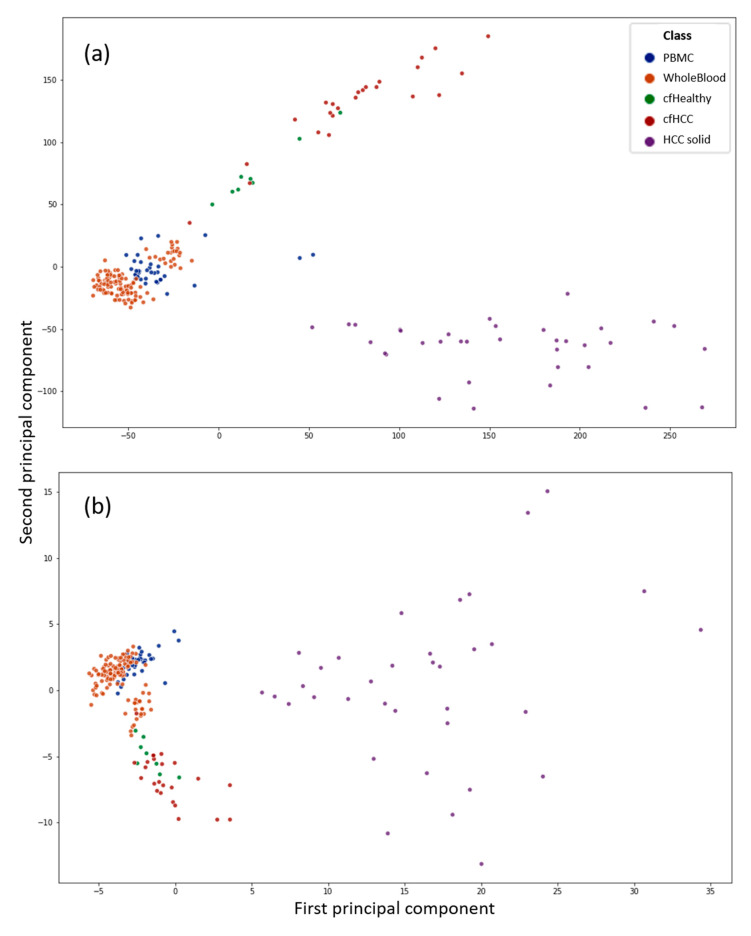
Figure 1.
Principal component analysis (PCA) of the complete dataset. The features were in the form of CpG sites in (a) or computed CpG islands in (b). Blue is associated to purified peripheral blood mononuclear cell (PBMC) samples, while orange shows whole blood samples, where the complete DNA that can be found in a blood sample is extracted without further purification. The violet dots represent solid hepatocellular carcinoma (HCC) samples. Green and red are healthy and cancerous cfDNA samples extracted from plasma, respectively. The highest red dot in (b) located between the lower orange cluster is the sample cfDNA_6032742_Cirrhosis_with_HCC, which is the most mispredicted sample by all classifiers. In (a), it is the lowest red dot in proximity to the blood sample cluster.

