Figure 1.
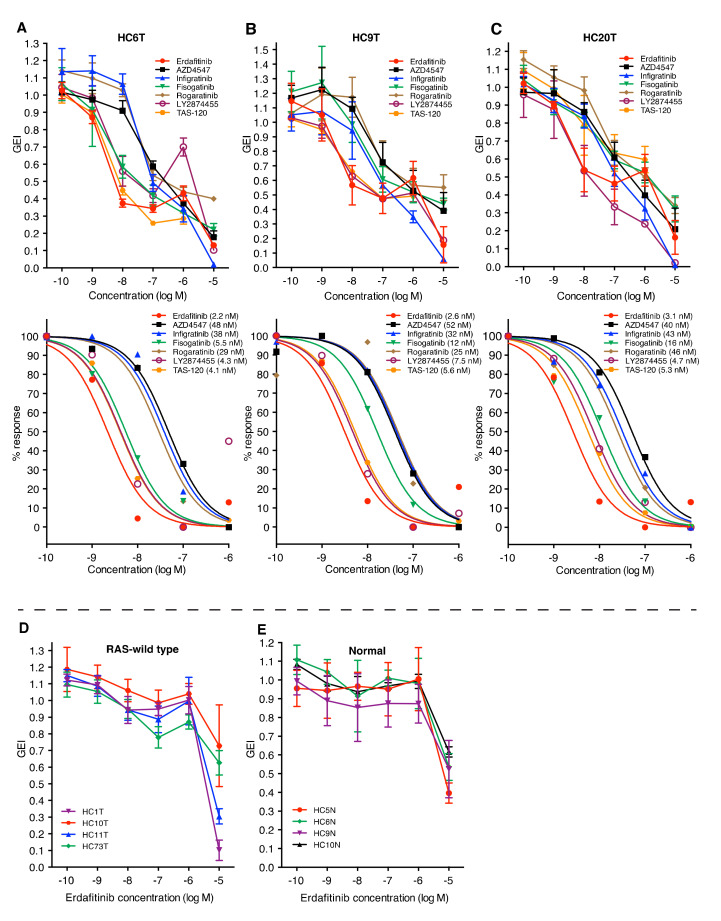
Effects of FGFR inhibitors on the in vitro growth of colorectal cancer TIC (tumor-initiating cell) spheroids. (A–C), Dose-dependent effects (top; raw data) and computer-fitted dose–response curves (bottom) of seven FGFR inhibitors (erdafitinib, AZD4547, infigratinib, fisogatinib, rogaratinib, LY2874455, and TAS-120) on the growth of three colorectal cancer TIC spheroid lines: HC6T (A), HC9T (B), and HC20T (C). Luciferase-expressing spheroid cells were cultured for three days with indicated concentrations of drugs, and their relative growth rates (growth effect indices; GEI) were calculated from the photon counts. The IC50 value is also shown in parentheses for each drug. The data at the concentration of 10-5 M (10 μM) were excluded from the computation of the best-fit dose–response curves because of their non-specific nature of the toxicity (see also D,E). Some dose–response curves overlapped in HC6T (LY2874455 and TAS-120) and HC9T (AZD4547, infigratinib and rogaratinib). (D) Effects of erdafitinib on the growth of another set of RAS/RAF wild-type colorectal cancer spheroid lines, HC1T, HC10T, HC11T, and HC73T. (E), Effects of erdafitinib on the growth of four normal colonic epithelial stem cell spheroid lines (HC5N, HC6N, HC9N, HC10N). All sets of data show the mean values ± SD of three independent experiments each of which was performed in four replicates.

