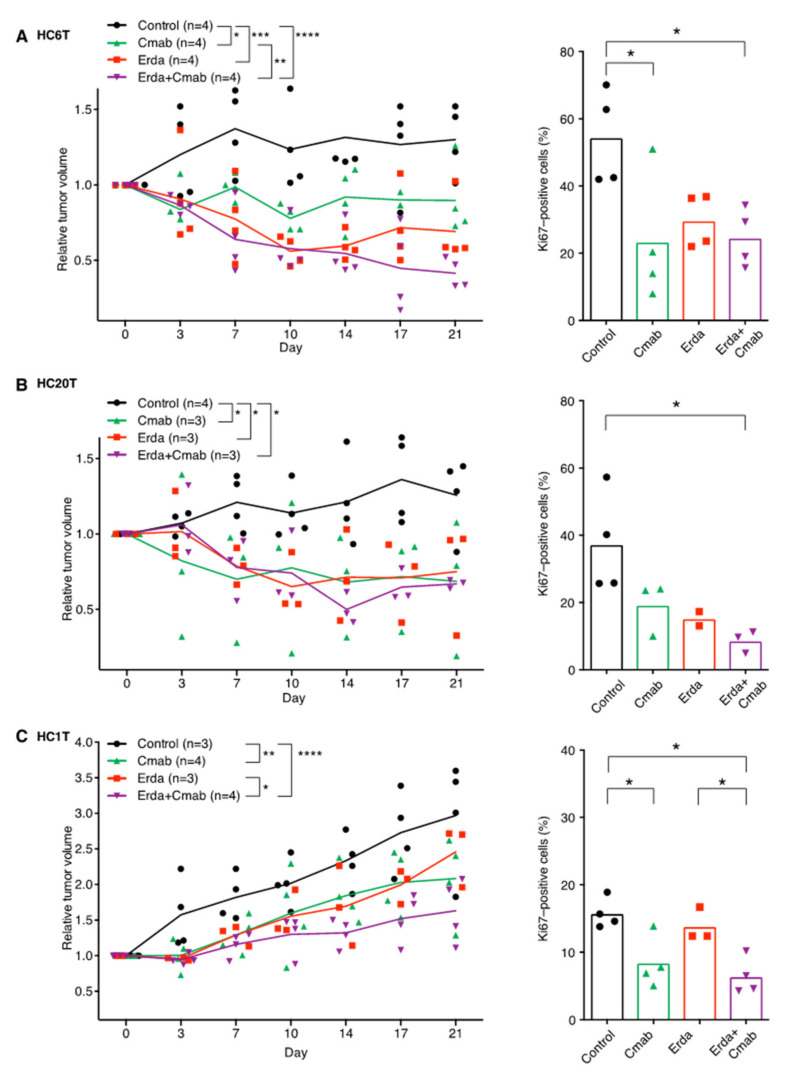
Figure 4.
Drug-sensitivity tests with erdafitinib and/or cetuximab against PDSX-tumor growth in mice. (A–C), left. Changes in the relative subcutaneous tumor volumes of HC6T (A), HC20T, (B) and HC1T (C) xenografts during drug treatments. (A–C), right. The fraction of proliferating cells (%) monitored by Ki67 expression for each treatment group. The mean values are shown as bars with raw data points in symbols of various shape. Among HC20T PDSX mice, one of the three tumors in the erdafitinib monotherapy group disappeared (complete response), and it is not included in the figure (B, right). The statistical significance of the data difference is shown; *, p < 0.05; **, p < 0.01; ***, p < 0.001; or ****, p < 0.0001; in one-way or two-way ANOVA followed by Tukey’s post-test.

