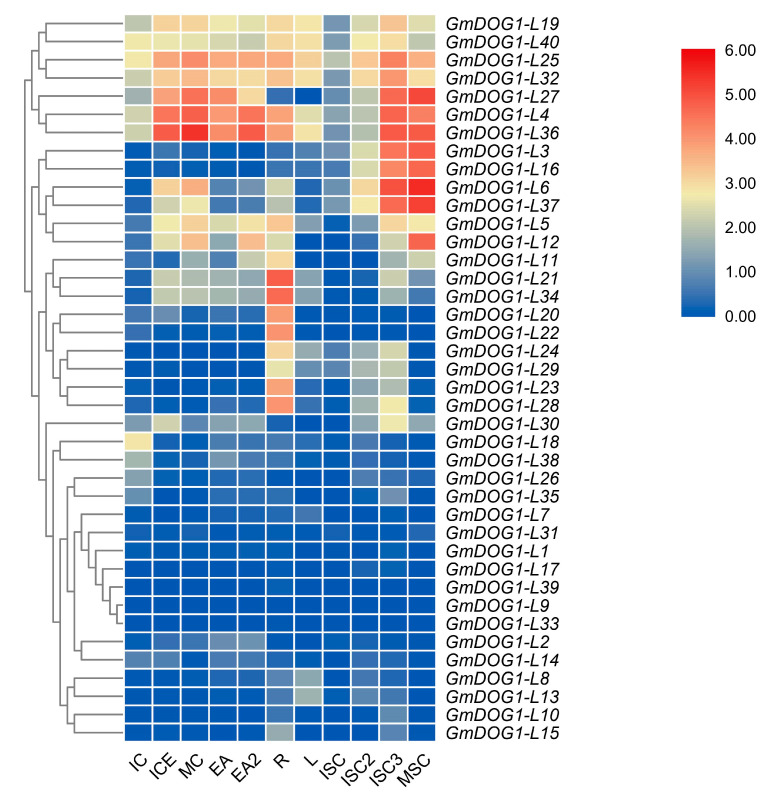
Figure 4.
Hierarchical clustering of GmDOG1Ls transcriptome expression profiles including 11 samples at different tissue and developmental stages. Immature cotyledon (IC), immature cotyledon without embryo axis (ICE), mature cotyledon (MC), embryo axis-Stage: 300–400 mg (EA), embryo axis-Stage: 200–300 mg (EA2), roots (R), leaves (L), immature seed coat-Stage: 5–6 mg (ISC), immature seed coat-Stage: 25–50 mg (ISC2), immature seed coat-Stage: 200–300 mg (ISC3) and mature seed coat (MSC) were sampled for RNA-seq analysis.

