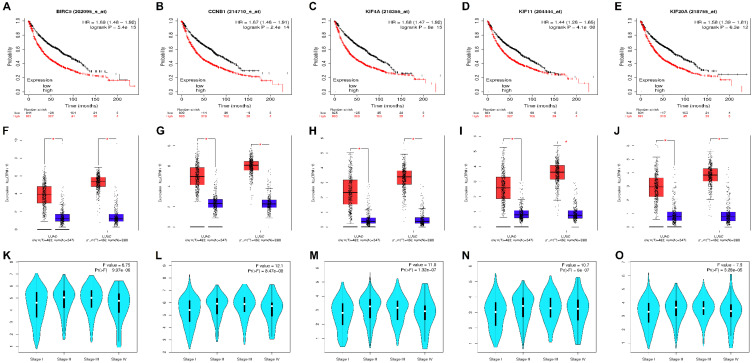
Figure 4.
KM survival curves of hub genes [A] BIRC5, [B] CCNB1, [C] KIF4A, [D] KIF11, and [E] KIF20A plotted using KM plotter. The red line denotes patient samples with a higher gene expression level and the black line denotes patient samples with a lower gene expression level. Higher expression levels of these genes tend to worsen the OS in NSCLC patients. All these genes were highly significant (log rank p < 0.05). Boxplots comparing the relative expression levels of hub genes [F] BIRC5, [G] CCNB1, [H] KIF4A, [I] KIF11, and [J] KIF20A in LUAD and LUSC patients with respect to normal samples. The thick horizontal line in the middle depicts the median, and the lower and upper limits of each box depicts first and third quartiles, respectively. The bottom and top of the error bars depict the minimum and maximum values of expression data. The red and blue boxes depict the NSCLC (LUAD/LUSC) and normal tissues. The method for differential analysis was one-way ANOVA, using disease state as a variable for computing differential expression and asterisk signifies statistically significant with each dot indicating a distinct tumor or normal sample. Violin stage plots of hub genes [K] BIRC5, [L] CCNB1, [M] KIF4A, [N] KIF11, and [O] KIF20A showing the association of their mRNA expression levels and various tumor stages in NSCLC patients. The white dots and black bars depict the median and interquartile ranges, respectively. The width of the turquoise colored shapes depicts the distribution density. The stages of lung cancer were represented by abscissa and the expression level of each hub genes are represented by its ordinate. The method for differential analysis is one-way ANOVA, using pathological stage as a variable for computing differential expression. A better study fit corresponds to a larger F-value. All the genes were statistically significant at p-value < 0.05 with CCNB1 having the best study fit (i.e., F-value = 12.1).

