Figure 5.
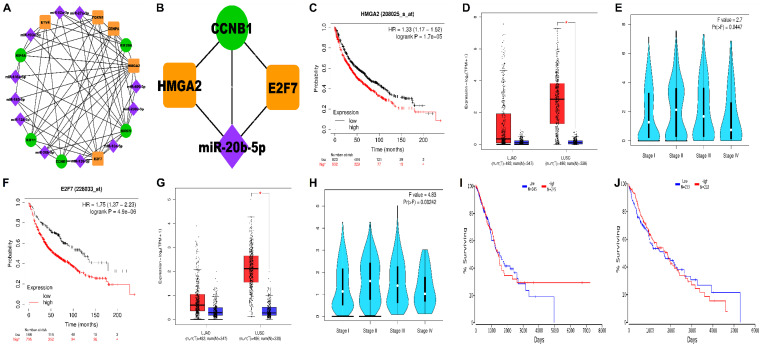
[A] NSCLC-specific 3-node miRNA FFL regulatory network comprising 21 nodes and 66 edges, respectively. [B] The highest-order network motif consisting of one miRNA (miR-20b-5p), two TFs (HMGA2 and E2F7), and one hub gene (CCNB1), respectively. The green circular nodes represent the hub genes/mRNAs, magenta diamond nodes represent miRNAs, and orange rectangular nodes represent the TFs, respectively. KM survival curves of [C] HMGA2 represents a shorter OS in NSCLC patients with its increased expression levels. Boxplot comparing the relative expression levels of [D] HMGA2 in LUAD and LUSC patients with respect to normal samples. Violin stage plot of [E] HMGA2 showing the association of its expression levels and various tumor stages in NSCLC patient samples. KM survival curves of [F] E2F7 represents a shorter OS in NSCLC patients with its increased expression levels. Boxplot comparing the relative expression levels of [G] E2F7 in LUAD and LUSC patients with respect to normal samples. Violin stage plot of [H] E2F7 showing the association of its expression levels and various tumor stages in NSCLC patient samples. KM survival curves of miR-20b-5p plotted using OncoLnc in [I] LUAD and [J] LUSC patient samples. Lower expression levels of miR-20b-5p tend to worsen the OS in both LUAD and LUSC samples.

