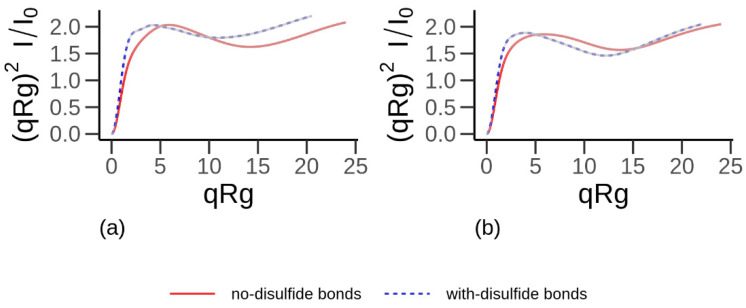
Figure 4.
Dimensionless Kratky plot (visualizing shape of proteins) of α-gliadin (a) and low molecular weight glutenin (b). The solid red curve corresponds to protein without intramolecular disulfide bonds, and the dashed blue curve corresponds to proteins with intramolecular disulfide bonds. Data obtained from all-atom simulations. q is the scattering vector [61] (also referred to as the momentum transfer), I is intensity, and I0 is the intensity of the incoming ray.

