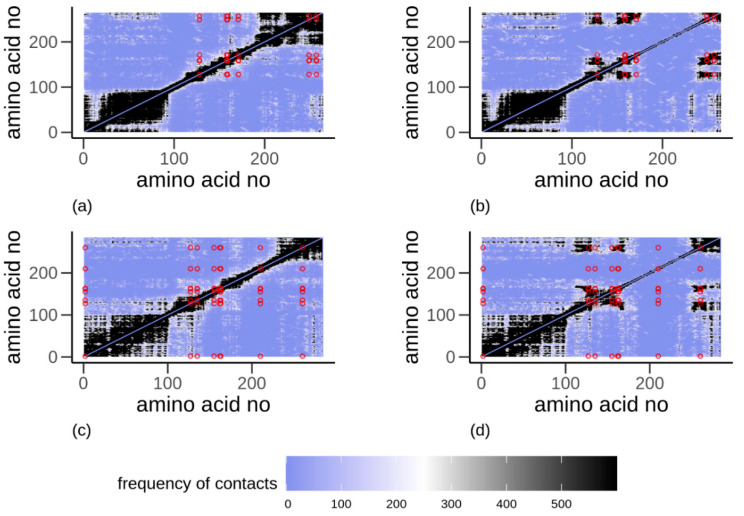
Figure 6.
Contact maps for (a,b) α-gliadin and (c,d) low molecular weight glutenin, (a,c) without disulfide bonds and (b,d) with disulfide bonds obtained from all-atom simulations. Dark regions indicate a high amount of contacts among amino acids. A high degree of contact among amino acid residues positioned two steps away is seen as a black diagonal. Dark areas annotated by circles show a high degree of contact between disulfide bonded cysteine residues.

