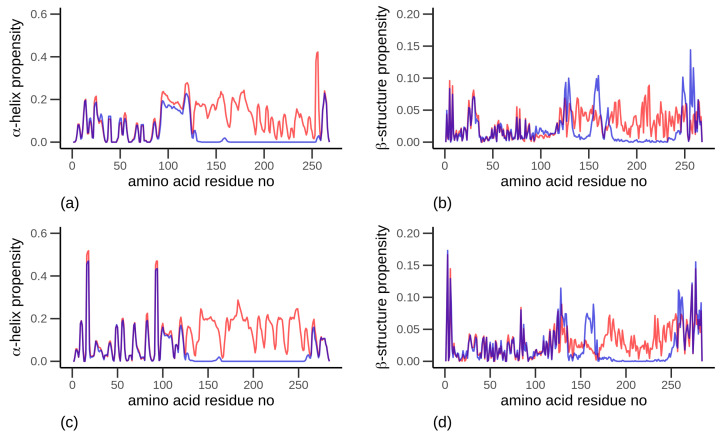
Figure 8.
Propensity of secondary structure for (a,c) α-helix and (b,d) β-sheets/strands, for (a,b) α-gliadin and (c,d) low molecular weight glutenin. The red curves indicate proteins without intramolecular disulfide bonds, and the blue curves indicate protein with intramolecular disulfide bonds. Observe the differences in scales, which were used to more clearly visualize the β-structure propensity. The data is obtained from all-atom simulations.

