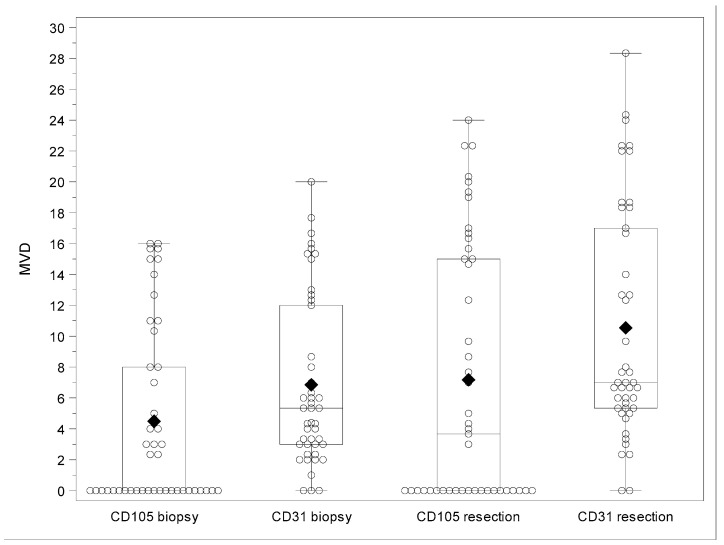
Figure 1.
Box- and scatter-plot of CD105- and CD31-associated MVD in biopsies and surgical specimens. The bottom and top edges of the box indicate the interquartile range (IQR). The diamond inside the box indicates the mean value and the line inside the median value. The whiskers extending from each box indicate the range of values that are outside of the interquartile range corresponding to a distance less than or equal to 1.5 × IQR or the minimum and maximum value in case outliers are not present.

