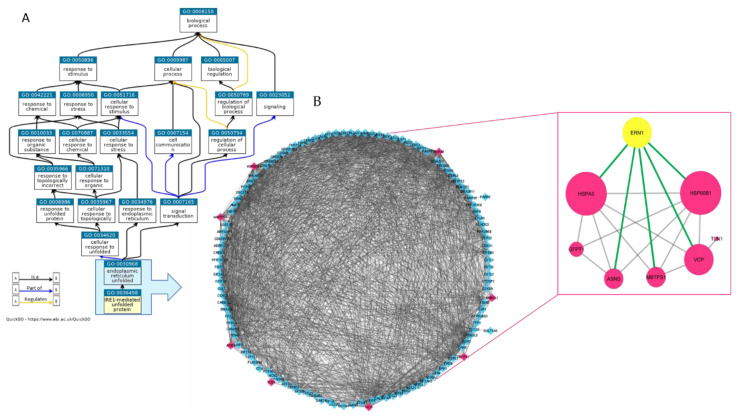
Figure 1.
(A) Ancestor Chart within the domain “Biological Process” visualized by QuickGO. The turquoise box GO_terms on which we focused our attention. (B) STRING networks imported into Cytoscape. On the left the network formed by the 121 proteins included in GO:0030968 and GO:0036498 is reported; the eight proteins highlighted in fuchsia are those found in human multiple myeloma cell line (MM1.s)-extracellular vesicles (EVs). The network on the right shows that these eight MM1.s-EV proteins are reciprocally interconnected and five of them are directly connected to ERN1 (the inositol-requiring enzyme-1 alpha (IRE1α)). The node size indicates the number of connections of each node.

