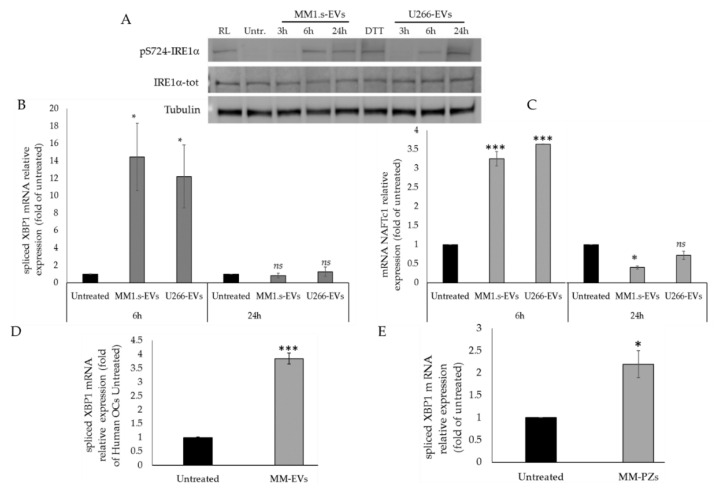
Figure 2.
(A). Western blotting analysis of pS724-IRE1α and IRE1α-tot in Raw264.7 cells treated with 25 μg/mL of MM1.s-EVS and U266-EVs for 3, 6 and 24 h; as positive controls, Raw264.7 cells were also treated with 25 ng/mL of hrRANKl (RL) and 10 mM DTT (reducing agent used as unfolded protein response (UPR) inducer). Tubulin was used as loading control. (B). qRT-PCR analysis of XBP1 spliced in Raw264.7 cells treated for 6 and 24 h with 25 μg/mL of MM1.s-EVs and U266-EVs. Data were normalized for GAPDH and values are expressed as fold of control (untreated cells). (C). qRT-PCR analysis of Nfatc1 in Raw264.7 cells treated for 6 and 24 h with 25 μg/mL of MM1.s-EVs and U266-EVs. Data were normalized for GAPDH and values are expressed as fold of control (untreated cells). (D). qRT-PCR analysis of XBP1 spliced in human primary osteoclasts (OCs) treated for 3 days with 25 μg/mL of MM1.s-EVs (MM-EVs). Data were normalized for GAPDH and values are expressed as fold of control (untreated cells). The statistical significance of the differences was analyzed using a One way ANOVA (treated Group vs. Untreated Group). (E). qRT-PCR analysis of XBP1 spliced in EVs isolated from the bone marrow blood samples of patients affected by MM (n = 3). The statistical significance of the differences was analyzed using a Dunnett’s test (treated Groups vs. Untreated Group) (* p-value < 0.05, *** p-value < 0.0005, ns not significant).

