Figure 5.
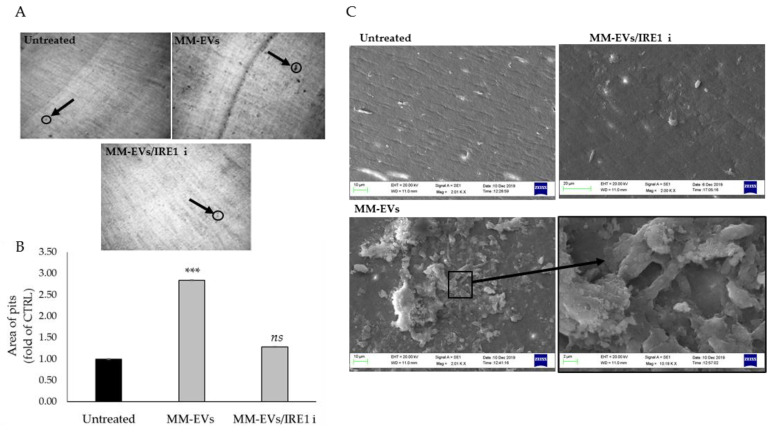
(A). Bone resorption pit assay of Raw264.7 cells seeded on dentine discs untreated or treated for 6 days with 25 μg/mL of MM-EVs alone or in co-treatment with IRE1ι. Representative pictures of lacunae (dark areas) formed by cells (original magnification 10×) are reported. Black arrows are added to indicate some resorption pits. (B). Data relative to the resorbed areas by mature OCs, after 6 days of treatment with 25 μg/mL of MM-EVs or co-treated with MM-EVs and IRE1ι, are represented as fold increase of Raw264.7 untreated cells. Three fields of each dentin disc for each experimental point were scored in three independent experiments. The area of the pits was calculated by NIH image J software analysis (htttp:/rsbweb.nih.gov/ij/). The statistical significance of the differences was analyzed using a Dunnett’s test (treated Groups vs. Untreated Group) (*** p-value < 0.0005, ns not significant). (C) Representative pictures of lacunae formed by OCs through SEM analysis (images at 1.10 K× and 2.01 K× magnification).

