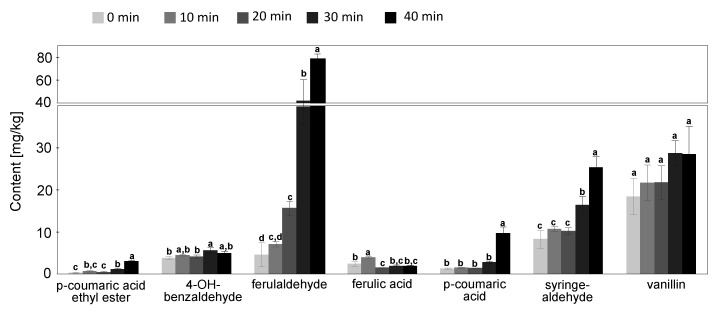
Figure 4.
Changes of phenolic compounds composition during roasting process shown as concentration in mg/kg (mean ± SD, analytical replicate = 3). Values with different letters for each compound are significantly different in comparison to the other time points by applying Tukey–Kramer HSD test (p < 0.05).

