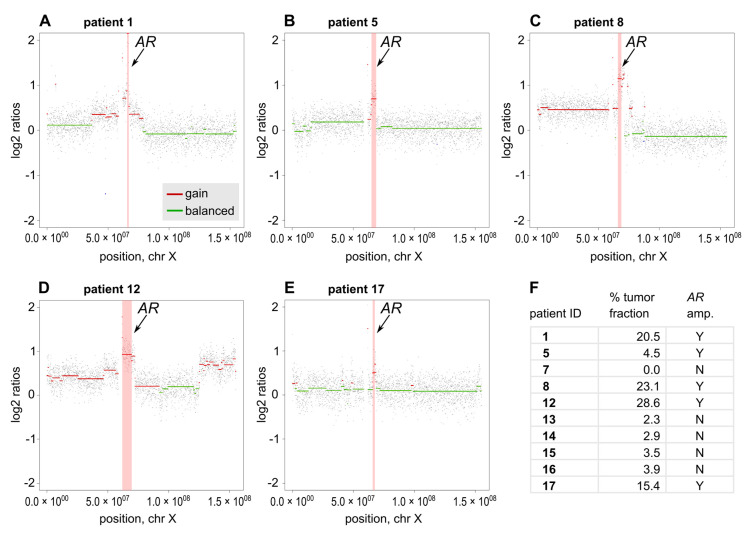
Figure 4.
Plasma-Seq reveals copy number alterations and focal AR amplification. (A–E) Log2 ratio plots of the chromosome X of patients with AR amplifications (patients 1, 5, 8, 12, and 17). The copy number gain on Xq12, which harbors the AR gene, is highlighted. Gains are depicted in red and balanced segments in green. (F) Overview of plasma-Seq results of all patients showing % tumor fraction assessed with ichorCNA and presence (Y) or absence (N) of AR amplification.

