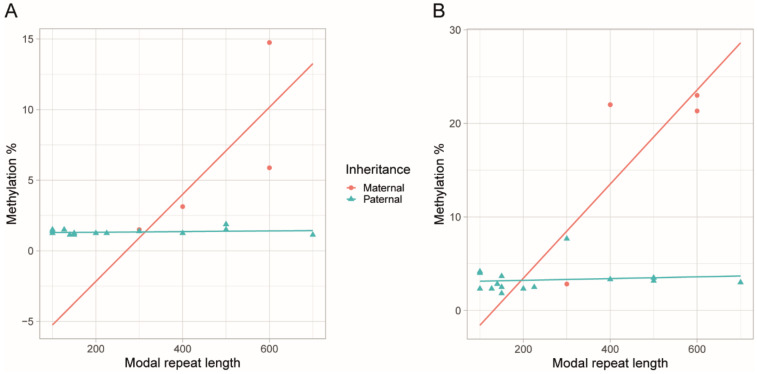
Figure 3.
The scatter plots with regression lines show the relationship between the modal repeat size and the methylation levels of the CpG sites of the patients for whom we knew the parental origin of the disease allele. For neither the upstream (A) nor downstream (B) CpG sites there was a correlation between the modal repeat length and the methylation levels in the patients who had inherited the disease paternally. As the number of the patients who had inherited the maternal disease allele was too low (n = 4), it was not possible to make a confident statistical analysis.

