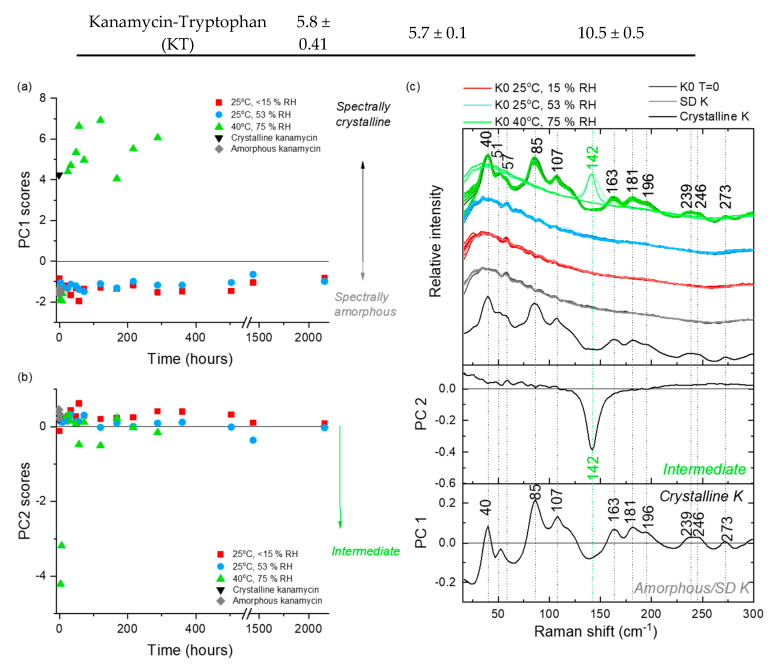
Figure 5.
PCA analysis of the LFR spectra collected from KO samples stored under three different conditions (25 °C/<15% RH, 25 °C/53% RH and 40 °C/75% RH) over time. (a) PC 1 scores versus time, (b) PC 2 scores versus time and (c) loadings with comparative spectra. PC 1 accounts for 88% of the explained spectral variance and PC 2 accounts for a further 8% explained variance. Spectra from the different storage conditions in (c) have slight color graduations to highlight early (lighter coloring) versus latter (darker coloring) time points.

