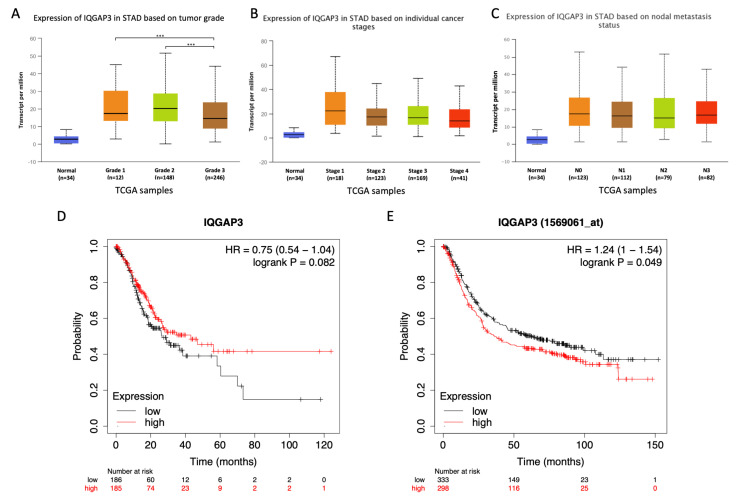
Figure 2.
Expression of IQGAP3 and overall survival rate in patients with low and high IQGAP3 expression in the TCGA database. (A–C) Expression of IQGAP3 in patients with different tumor grades, cancer stages, and nodal metastasis status as compared with normal controls. Of note, all the tumor subgroups in A–C had statistically significantly higher IQGAP3 expression compared to normal controls (***, p < 0.001) (blue boxes). Overall, no significant differences among subgroups were identified. (D,E) Kaplan–Meier plots showed no statistically significant differences in overall survival using the RNA-seq dataset (D). However, statistically significant poorer overall survival was observed in patients with higher IQGAP3 expression when using a microarray dataset (E). The median value of IQGAP3 expression was selected as a cut-off for low and high expression in (D) and (E).

