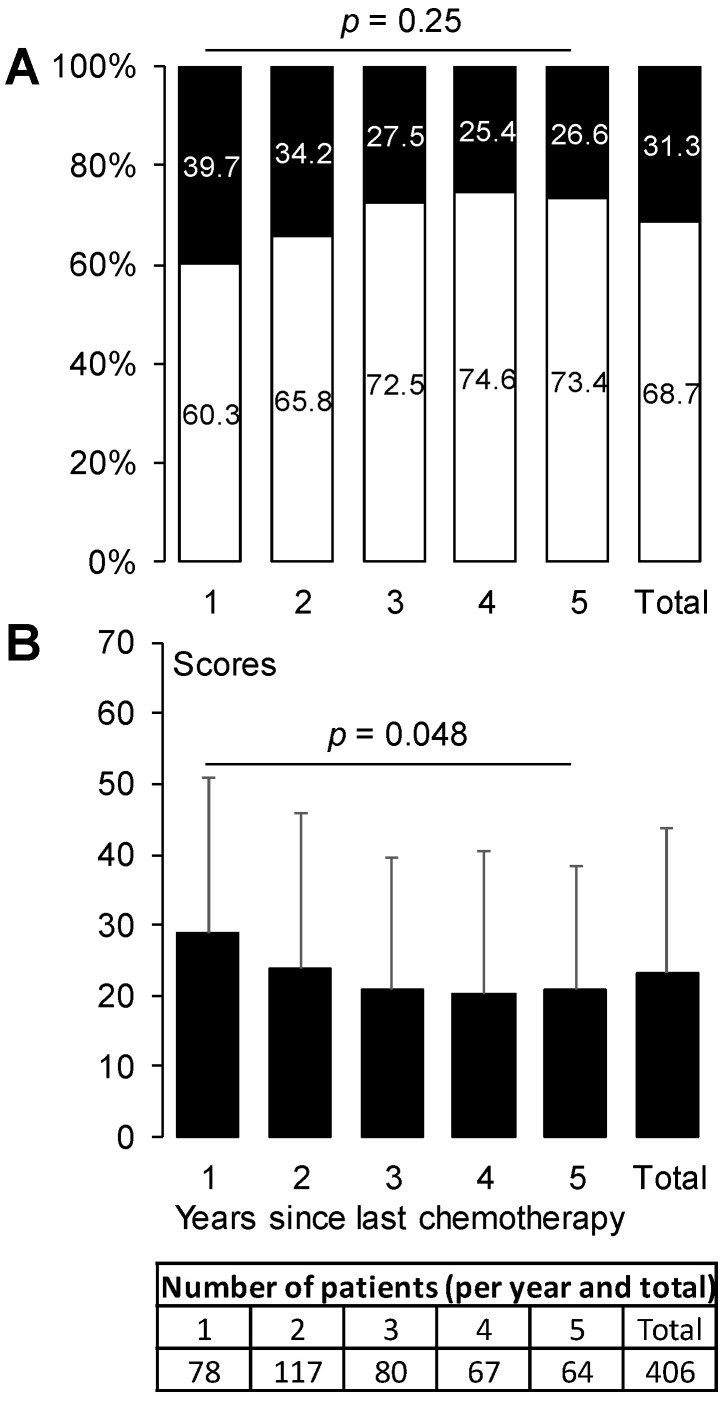
Figure 2.
Prevalence of sensory CIPN and QLQ-CIPN20 sensory scores from 1 year until 5 years after chemotherapy end. The prevalence of sensory CIPN (A) is expressed as a percentage (white: no CIPN, black: sensory CIPN). The sensory scores (B) are expressed as mean ± standard deviation. p-values are provided for global comparison over time (from year 1 to year 5). CIPN, chemotherapy-induced peripheral neuropathy.

