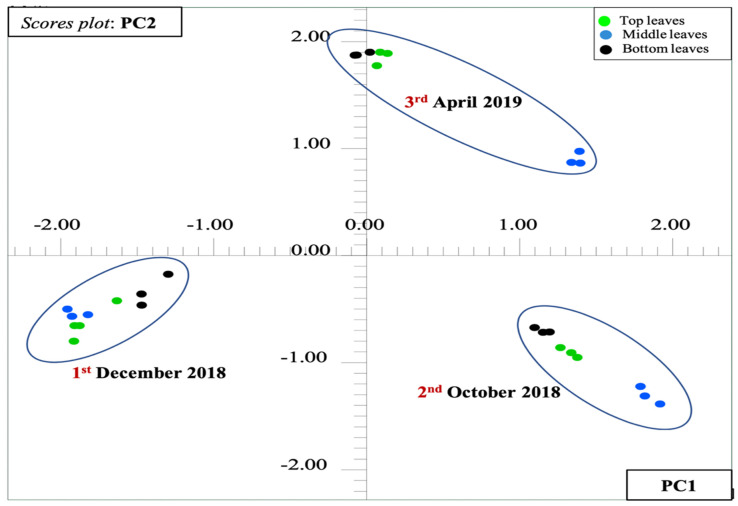
Figure 11.
Scores plot from the principle component analysis (PCA) performed over 1H HR-MAS NMR spectra (ẟ 10.0–0.60, 0.04-ppm bucket size, and pareto-scaled) acquired directly from the leaves of Berberis laurina showing discrimination according to the season time. PC1 (50.25%) vs. PC2 (32.09%) of the 28 × 174 data matrix that revealed a net variance of 82.34%.

