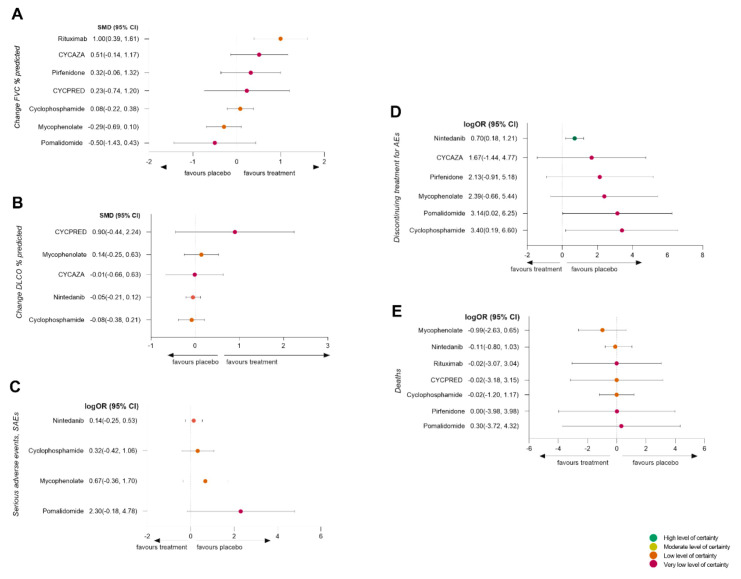
Figure 3.
Forest plots. Forest plots of network meta-analysis of all trials: (A), change in forced vital capacity % of predicted (FVC %); (B), change in diffusion lung capacity for CO % of predicted (DLCO %); (C), number of patients with serious adverse events (SAEs); (D), number of patients discontinuing treatment for adverse events (AEs); (E), deaths. Treatments were compared with the placebo. SMD, standardized mean difference; log OR, odds ratio. CI, confidence interval.

